In a presentation given by Jurgen Zettl at the EM2010 conference in Vienna, the author reports about the integrated energy management and reporting at Sandoz’ Kundl site.
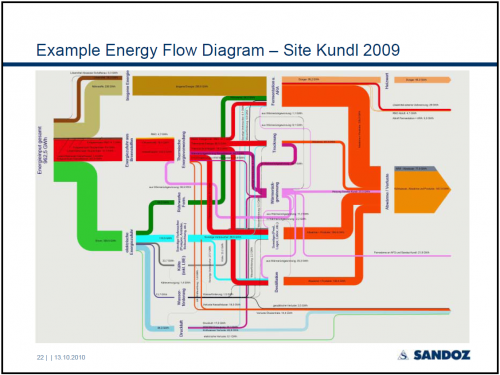
Page 22 of the PowerPoint has the following Sankey diagram:
The pic isn’t very clear, and it is difficult to see any detail. The overall energy consumption of the Kundl site comes in from the left (962,5 GWh in 2009). It is broken down to electric energy, energy from fossil fuels and energy from biomass (Note: I was wondering about the latter, but this is explained on page 6 that this is “feed for fermentation, solvents, … “). The streams are further broken down by use area. At the right side the flows join again to visualize useful energy and energy losses.
Good to see that large industries are using Sankey diagrams as an important element of their integrated energy management…

8 Comments
Comments are closed.