Tag: energy efficiency

Cogen System Thermodynamic Analysis

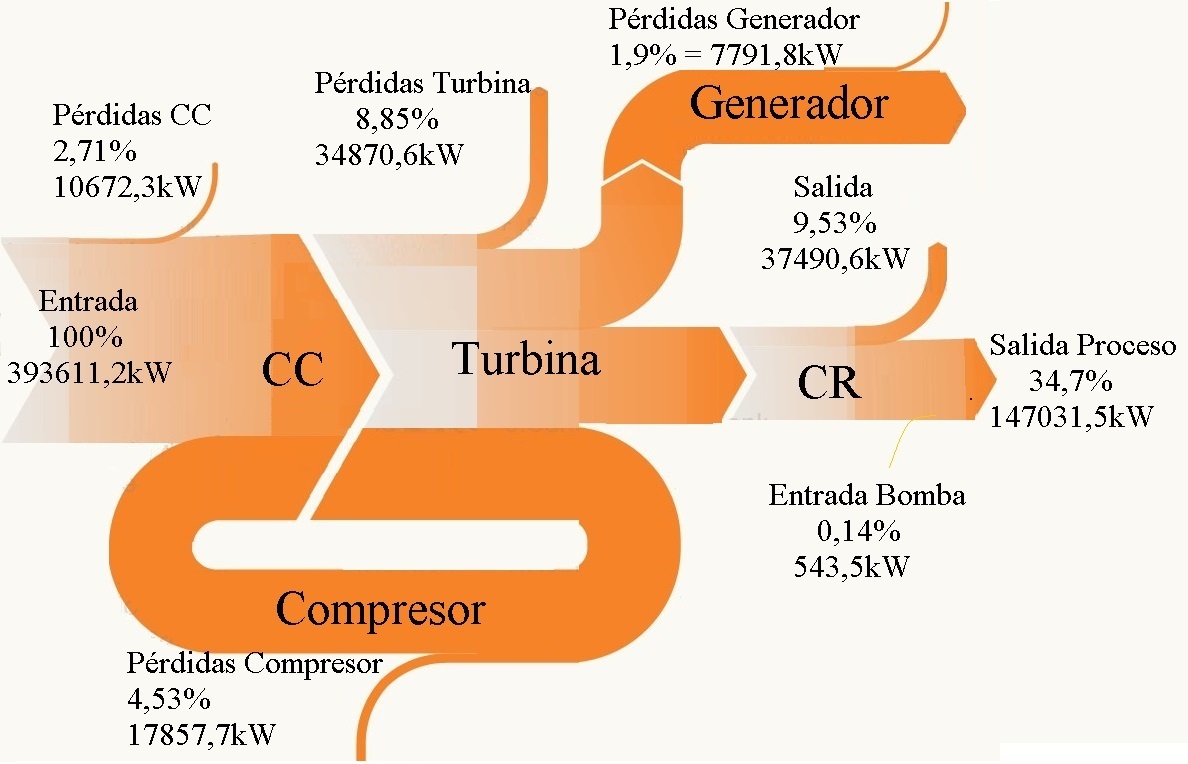
An analysis of energy efficiency and exergy effciency of a cogeneration system in a sugar refinery in São Paulo state in Brazil is presented in the ‘Análisis energético, exergético y económico de un sistema de cogeneración: caso para una planta azucarera de San Pablo’ by Omar R. Llerena of Universidade de São Paulo (Published in: Ingenius no.19 Jan/Feb 2018 under Creative Commons license CC BY-NC-SA 4.0)


Flows are in kW, and even though this diagram appears to be ‘casero’ made from blocks, triangles and curve shapes, the flow widths seem pretty much to scale.
Acronym ‘CC’ is for the combustion chamber and ‘CR’ stands for a heat recovery boiler (caldera de recuperación).

The article also features a Grassman diagram for the exergy analysis. So, if you are interested, please visit the article here.
Energy Efficiency of Ships, Deltamarin

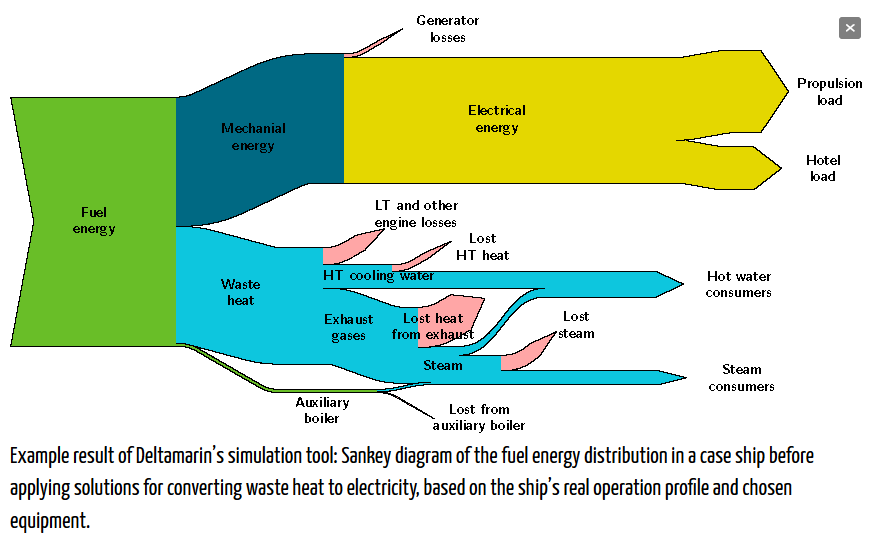
Deltamarin Ltd, a Finnish maritime engineering and consulting firm has developed a simulation and analysis tool, that allows to study the energy efficiency of ships. The model takes into account not only the vessel speed and fuel consumption, but also the secondary on-board electricity consumers and waste heat recovery. Results are shown in a Sankey diagram like the one below.


The Sankey diagram in this pic doesn’t show any numbers or unit of flow, so we can only conclude from the arrow magnitudes that about 50% of the energy is lost as heat at the engine (some of which is recovered for heating of water).
I am not sure about the propulsion being electric though.

The design of the diagram is rather crude and diagonal lines are visibly pixelated. But nevertheless it seems like a good way to get the energy efficiency model result data across other than in a table.

Watch this video where a Deltamarin engineer explains the simulation model and also the Sankey diagram.

Spendings on Energy Efficiency Measures

This is quite an interesting Sankey diagram from the World Energy Outlook 2014. It visualizes international spending on energy efficiency measures in the transport sector under a hypothetical ‘New Policies Scenario’.

A total of 14.5 trillion US$ would be spent until 2040 to improve energy efficiency in the transport sector. The largest chunk (37%, 5.3 trillion US$) on improving private cars. This amount is further broken down to four geographic regions. The money would be spent mainly on improving the power train, and on development of light-weight components.

The underlying scenarios are described in detail at the beginning of the WEO-2014 study. The authors point out that “[f]or each scenario, we offer a set of internally consistent projections to 2040. None should be considered forecasts.”

“The New Policies Scenario is the central scenario of WEO-2014. It takes into account the policies and implementing measures affecting energy markets that had been adopted as of mid-2014, together with relevant policy proposals, even though specific measures needed to put them into effect have yet to be fully developed. These proposals include targets and programmes to support renewable energy, energy efficiency, and alternative fuels and vehicles, as well as commitments to reduce carbon emissions, reform energy subsidies and expand or phase out nuclear power.”

Refurbishment of Thermal Power Plants

The conference paper ‘Repowering: An option for refurbishment of old thermal power plants in Latin-American countries’ (in: Proceedings of ASME Turbo Expo 2010: Power for Land, Sea and Air GT2010 (June 14-18, 2010, Glasgow, UK). DOI: 10.1115/GT2010-23058) by Irrazabal Bohorquez et al. of the Universidade Federal de Itajubá (UNIFEI) in Brazil has several Sankey diagrams to visualize energy flows in repowered thermal power plants.

Flows are im MWe. The base situation (A) in the power plant built in the 1970ies is shown in this Sankey diagram:

And the situation in one of the six refurbishment scenarios (B to G) for the power plant:

In the refurbishment scenario gas turbines (GT) are being installed. Exhaust gas is recovered and used in a heat recovery steam generation (HRSG).

For each scenatio the cost for generated electricity is assessed as well as the CO2 emissions associated with energy generation.
Check out the paper @ Researchgate for more Sankey diagrams.

Energy Efficiency made in Hesse

An English-language publication ‘A Practical Guide to Energy Efficiency in Production Processes’ published by the Ministry of Economics, Energy, Transport, Urban and Regional Development of the federal German state Hesse (PDF here) describes a structured approach and methodological toolbox to increase energy efficiency in large manufacturing companies. It also contains practical recommendations.

The below Sankey diagrams are based on data from a pilot implementation (“model project”) at a plastics manufacturer.

This is the Sankey diagram for the energy consumption (electricity and gas) in the existing (baseline) scenario

… and for one of the alternatives assessed in the project:

In this alternative scenario, heat is produced from natural gas rather than from electricity, thus reducing transformation losses. Heat recovery measures are also implemented. Flow values are in MWh per year for a given average production volume.

A second alternative scenario with trigeneration is also evaluated (see pp. 43-45 in the report) and potential cost savings and payback time are discussed.

From a design perspective the Sankey diagrams are quite okay, well structured. Some flaws can be noted in arrow segments that run diagonally, where the width of the arrow is not maintained. Overall energy supply and consumption are not shown in the diagram, but only individual values.

Energy Efficiency in Food/Beverage Industry

In a presentation on “Low CO2 production in European food and beverage industry” the author Christoph Brunner from AEE – Institute for Sustainable Technologies (AEE INTEC) suggests process flow sheets and Sankey diagrams as tools used for energy efficiency analysis.

This Sankey diagram is used as an example for the creation of mass and energy balances and the visualization of the production process.

The diagram is from Austria and thefore in German. From translating some words I understand this is probably for a food/dairy industry. Flows are in MWh, but without a time span. Two steam generators (one run with natural gas, the other with petroleum) supply heat to different processes. The cooking chambers (“Kochkammern”) require most, followed by “Selch” (?) and heating of a “KSPW Tank”. Some heat is recovered from condensate.

Sankey diagrams can help understanding the energy flows of process systems and detect hotspots for optimization.

Misc Sankey Diagrams Uncommented 10

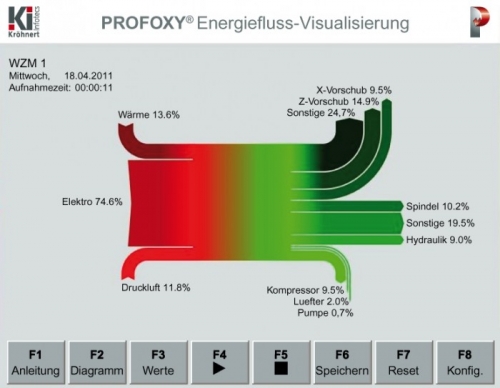
Energy flows are visualized on a machine touch screen panel, giving realtime information of energy consumption. This is from the PROFOXY system offered by Kröhnert Infotecs, a German engineering firm.

Basically two pie charts, one for the red part on the left side, and one for the green part on the right, would suffice (… I can’t believe I’m actually advocating pie charts here 🙁 ), but this Sankey diagram additionally gives a notion of “flow” and allows a grouping of consumers (on the right).

Rytec: Analysis of Waste Incineration Plant

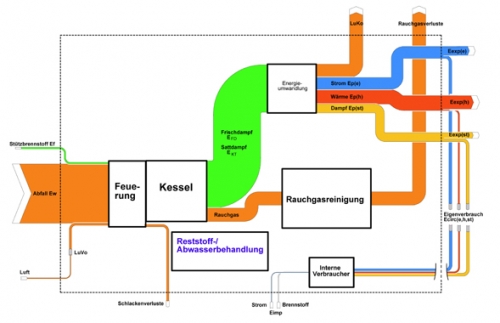
Consulting firm Rytec analyzes energy and heat utilization level of Swiss waste incineration plants and visualizes the processes using Sankey diagrams.

This Sankey diagram from their website is a simplified view and offers no details as to the actual figures. More detail can be found in this project summary (PDF).

Diagram labeled in German, but thanks to my friend Google Translate, I can identify ‘heating’, ‘boiler’, ‘energy conversion’ and ‘flue gas losses’. Orange streams to the top are losses.