Tag: biomass

Wood Biomass in The Netherlands

This Sankey diagram on wood biomass flows in the Netherlands is featured in the study ‘Sustainable biomass and bioenergy in the Netherlands’ by Goh, Mai-Moulin and Junginger from Utrecht University.


Flows are in million tons (MT) dry mass for the year 2014. The diagram has a very clear structure. Import streams are from the top and exports leave to the bottom. Domestic Dutch production is from the left, use of wood biomass in the Netherlands is to the right. Paper and cardboard, alongside pulp are the largest flows, but mainly being imported and exported again, or circulating domestically as recycled paper.

The report has two other Sankey diagrams on oils and fats and carbohydrates used in different sectors in the Netherlands. See the full report here.

Rapeseed Production

From the museum of Sankey diagrams, here is a black&white classic. This Sankey process diagram for rapeseed oil production is taken from the year 2002 dissertation ‘Simultane Öl- und Proteingewinnung bei Raps’ (Simultaneous oil and protein production from rapeseed) by Andreas Waesche, Berlin Technical University.


Flows are in kilograms per ton of rapeseed input. Black is the water fraction, dark gray is oil, and light gray is oil free dry matter. Rapeseed husks, filtered matter and liquid rejects branch out on arrows to the right. Extract from the T4 separation stage (‘Extrakt als Ruckfuhrung’) is fed back into the second node although this loop is not shown here.

Biomass and Bioenergy in The Netherlands

The study ‘Sustainable biomass and bioenergy in the Netherlands’ was carried out by researchers Goh, Mai-Moulin and Junginger from Utrecht University in the framework of the Netherlands Programmes Sustainable Biomass. It looks at “biomass from the three major categories, i.e. woody biomass, oils and fats and carbohydrates used in different sectors in the Netherlands”.

For each of these three categories a Sankey diagram is presented, like for example this one for oils and fats.


The diagram has a very clear structure. Import streams are from the top and exports leave to the bottom. Domestic Dutch production is from the left, use of oils and fats in the Netherlands is to the right. Flows are in million tons (MT) dry mass. Data is for the year 2014.

See the full report here.

Global Agriculture Biomass Flows 2010

An interesting Sankey diagram on Global Biomass Flows 2010 can be found on the PBL Netherlands Environmental Assessment Agency website.


(Author: PBL, published under Creative Commons License CC BY 3.0)

This is from a research report ‘Integrated analysis of global biomass flows in search of the sustainable potential for bioenergy production’ published 2014 (available here) that estimates the worldwide biomass flows. It explains: “The biomass flows in the agro complex are presented in ExaJoules in the Sankey diagram (…). Using energy density data for all common commodities, the mass data have been converted to energy data. The energy content depends on the moisture content. In this study, the commonly referred weight–energy ratio’s were used.”

Basically, the diagram is made up from two main strands or pathways for biomass that are interlinked: In the top half the food production from agricultural soils (both crops and livestock breeding). In the lower half the grassland/meadows.

This is exclusively for the agricultural sector. The forestry sector is covered in a separate Sankey diagram (in one of my upcoming posts).

Note that small flow quantities (<3 EJ) are not to scale but rather have a minimum arrow width to keep them visible.

Chemicals from Lignocellulosic Biomass

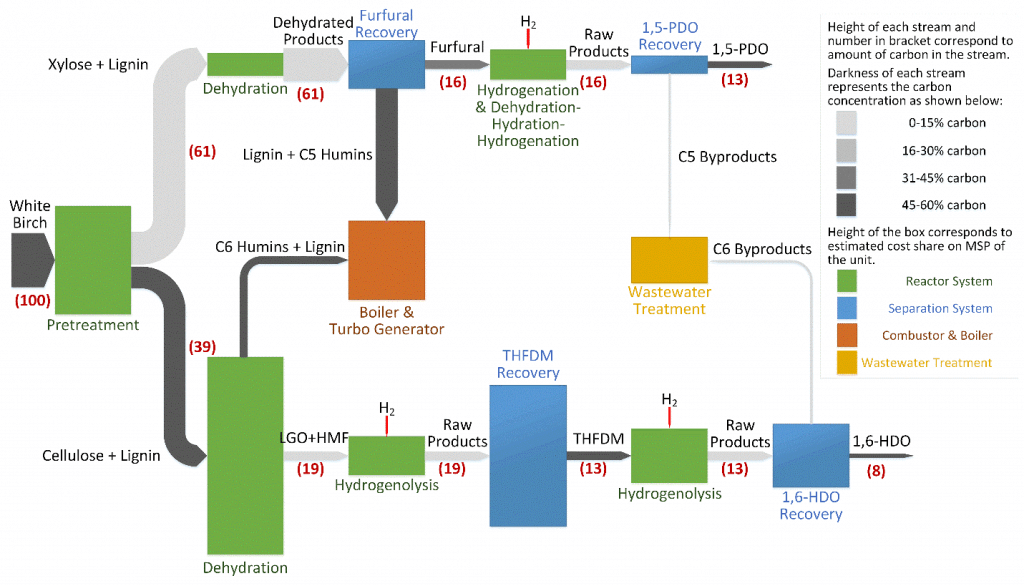
One of the research topics in the research group of Prof. Christos T. Maravelias at University of Wisconsin – Madison is ‘Renewable Chemicals from Lignocellulosic Biomass’. One line of research is into producing chemicals such as 1,4-butanediol (1,4-BDO), 1,5-pentanediol (1,5-PDO) and 1,6-hexanediol (1,6-HDO) from wood chips.

This process Sankey diagram is from the research description page of the Maravelias group.


The red numbers relate to the carbon content in the process (starting with 100% carbon molecules in the feedstock, white birch wood). The coloring of the Sankey arrows is used to signal carbon concentration. And the height of the process nodes shows the cost share of a unit in the process (no absolute cost, just relatively to each other). Interesting! Read more here.

Also see: TriVersa process

Finland Wood Flows, Two Versions

The below Sankey diagrams both show wood biomass flows for Finland for the year 2013.

The first one was published in the report VTT Technology 237 ‘Sustainability of forest energy in Northern Europe’ by researchers from VTT Technical Research Centre of Finland and Natural Resources Institute Finland (Luke).


Authors of this figure are Eija Alakangas and Janne Keränen. The diagram is oriented top-to-bottom and shows how the 104.4 Mm³ of round wood that grew in Finnish woods in 2013 were used. Basically there are two (three) main pathways, with a lot of arrows branching out to depict certain uses. 38.3 Mm³ of round wood was used in pulp industry, 26.2 Mm³ in the mechanical wood industry. Another 9.5 Mm³ of wood is used directly for energy generation.

The second Sankey diagram seems to be a remake of the above. It was published in a VTT Research Report on ‘Cascading use of wood in Finland – with comparison to selected EU countries’ by Laura Sokka, Kati Koponen, Janne T. Keränen.


Here the overall orientation is left-left-to right. The color scheme seems similar. There are some minor differences in the energy use part (orange and dark red arrows).

The first diagram has some images and comes across a little more playful than the second one. Although they depict the same data, I perceive them quite differently.
Is it due to the scaling or the vertical vs. horizontal orientation? Let me know your impression in the comments please.

Global Food System Sankey

Food losses and food waste has been addressed in a number of scientific research papers in recent years. Peter Alexander et.al. write about ‘Losses, inefficiencies and waste in the global food system’ (In: Agricultural Systems, Volume 153, May 2017, Pages 190-200, doi.org/10.1016/j.agsy.2017.01.014)

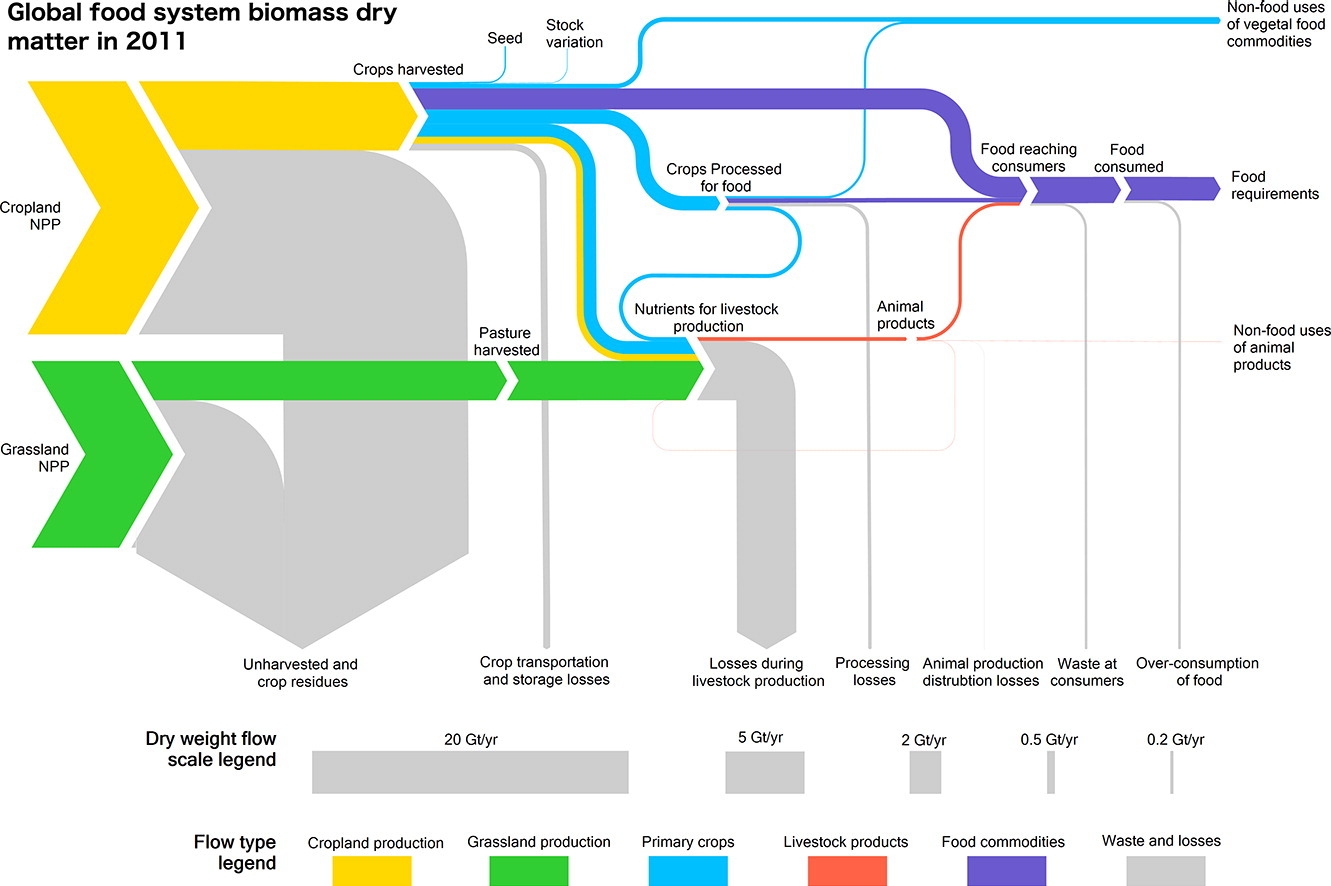
The article contains two beautiful Sankey diagrams. The first depicts the global food system in 2011. Flows are shown as dry mass. Flows are not individually labelled with the underling quantity, but rather a scale at the bottom shows 5 representative flow quantities and their corresponding width.


(under terms of Creative Commons Attribution 4.0 License (CC BY 4.0))

Crop (yellow) and grassland (green) net primary production (NPP) are shown as sources for the global food system. Losses are branching out as grey arrows. These “inefficiencies” of the system are described in detail in the article. The authors observe that “44% of harvested crops dry matter are lost prior to human consumption” and that “the highest loss rate can be found in livestock production”.

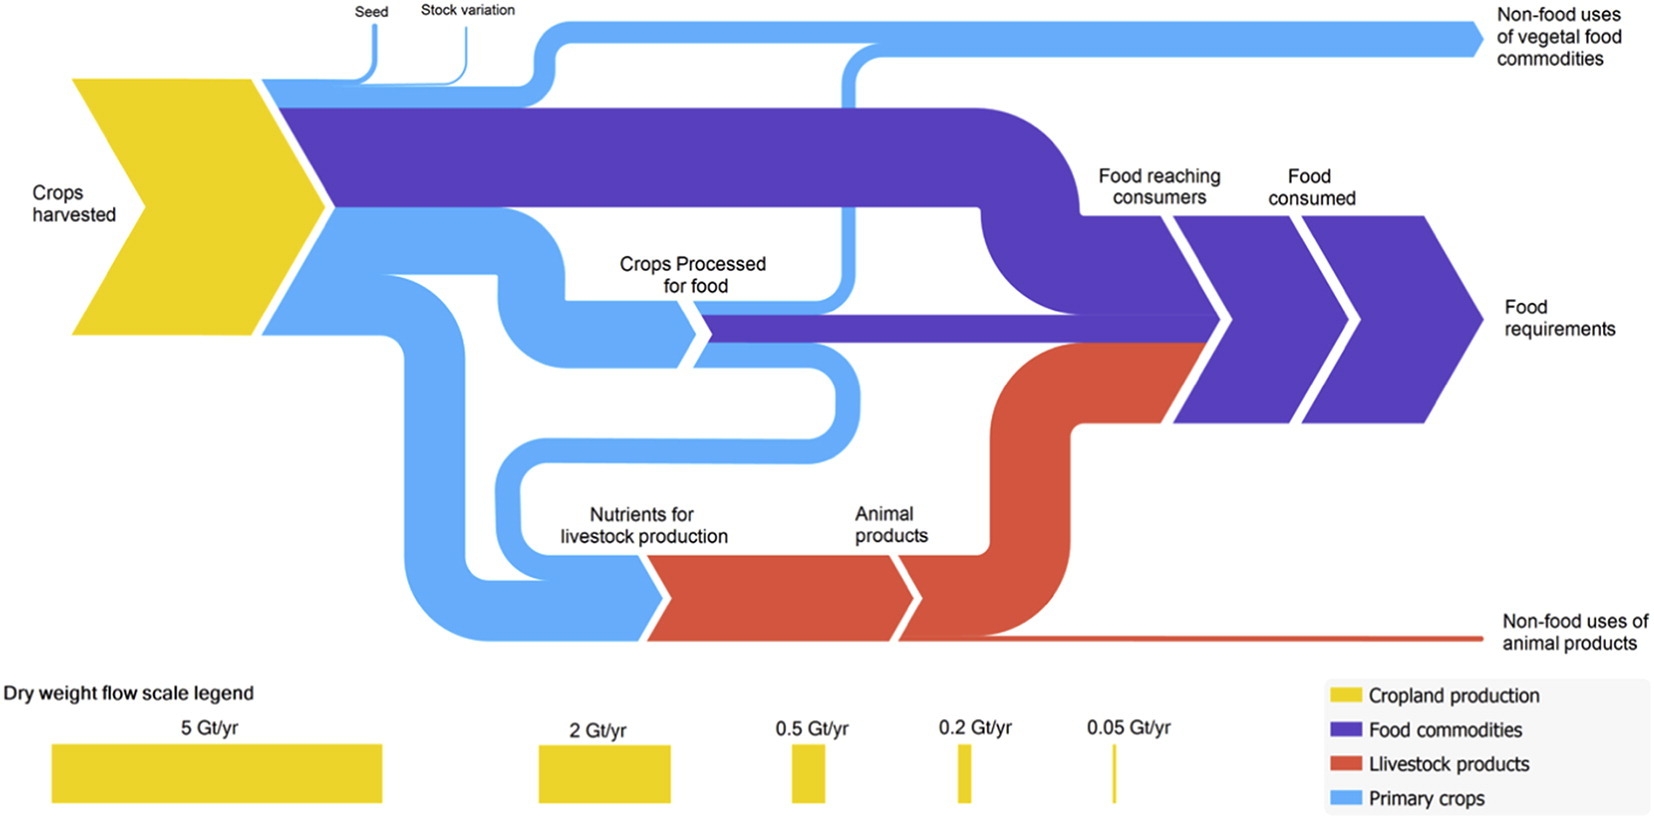
The second Sankey diagram shows a section of the above figure, just the dry matter flows from crop harvest and processing, without any losses. This is interesting because it allows us seeing the share of processed and non-processed food being consumed by humans worldwide, and the the share of crop-based food intake (dark blue) compared to animal-based food intake (red). You could call this the veggie / non-veggie split. Based on dry matter that is.


(under terms of Creative Commons Attribution 4.0 License (CC BY 4.0))

If you want to see the corresponding global food system wet mass, protein and energy Sankey diagrams check out this interesting article. A recommended read for all of us eaters.

Biogas in Auvergne-Rhône-Alpes region

The French region Auvergne-Rhône-Alpes in the south-east of the Hexagone borders with Switzerland and Italy. Lyon and Grenoble are located in this region, known for skiing, lush pastures … and great cheese!

Auvergne-Rhône-Alpes Énergie Environnement (AUR-EE) is a regional agency that works to bring together players in the renewable energy field and to promote RE projects.

Given the agricultural character of Auvergne-Rhône-Alpes, biomass use for energy generation has been going strong in recent years. The agency has created energy flow Sankey diagrams for existing biogas installations, as well as a projection for the ones being under development.
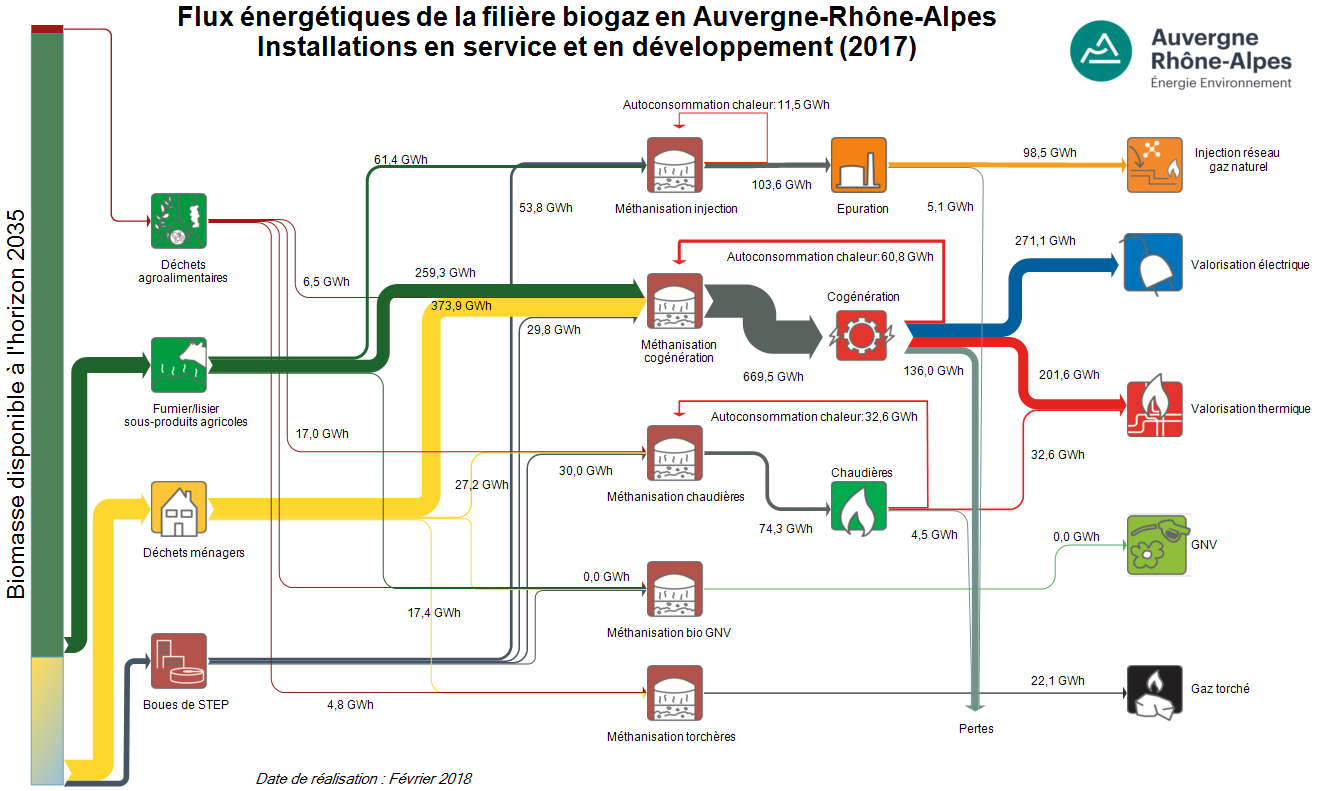
Data is for 2017 and for the scenario where all projects currently under development would already completed. The yellow stream (‘déchets ménagers’) is household waste, providing 374 GWh of energy. Manure and other side-products from agriculture (green arrow) contributes another 260 GWh.
The stacked bar on the left hand side of the diagram indicates the potential availability of biomass by 2035, and one can see that only a small fraction of it is currently being taken advantage of.
Biogas is produced in anaerobic digesters (‘méthanisation’) and the region yields some 271 GWh electricity and 200 GWh heat per year from cogeneration plants. Already almost 100 GWh of biogas could be injected to the natural gas network, allowing for storage of the energy.

Note that smaller or even negligible flows are still shown with a minimum width in order to make them visible (these thinner arrows are not to scale with the others).