Tag: biomass

TriVersa biorefinery process

Javier Dufuor on the madrid+d Energía y Sostenibilidad blog reports about a novel lignocellulose biorefinery process developed by Prof. James A. Dumesic at the University of Wisconsin-Madison. This so-called TriVersa process can yield up to 80% of biomass from birch wood as marketable products.

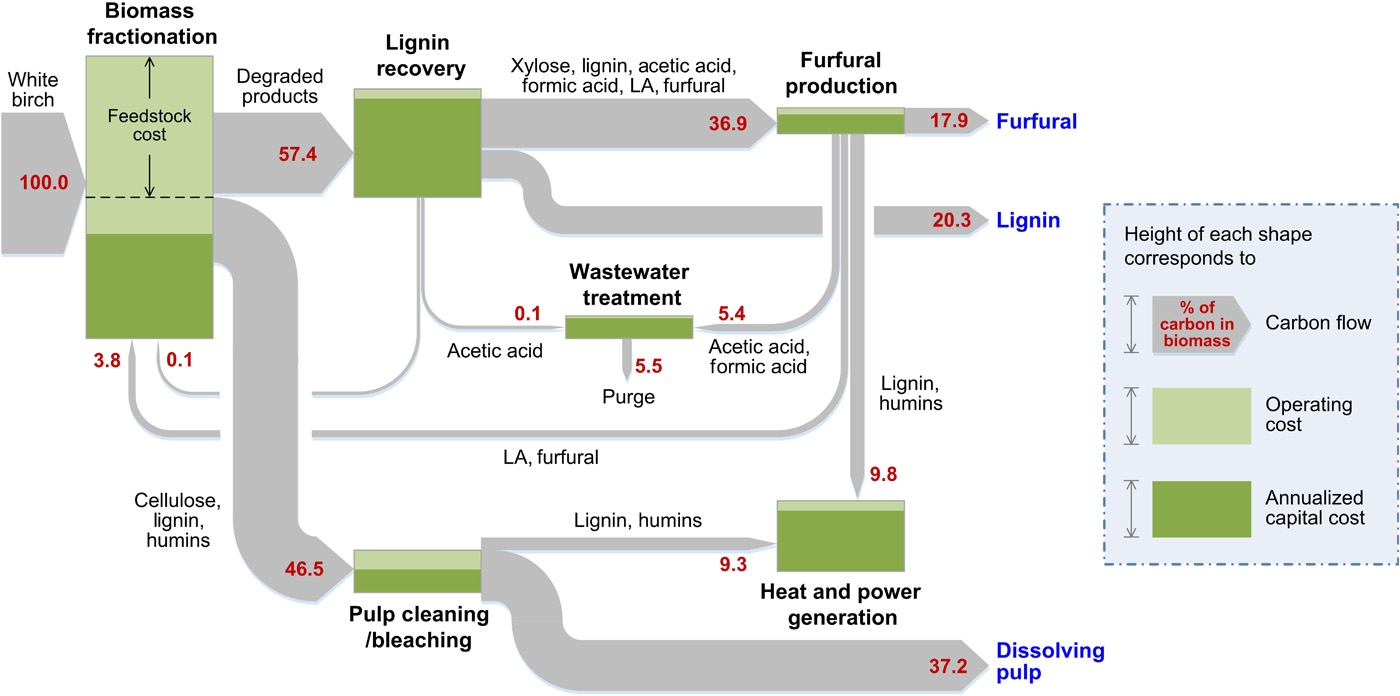
The Sankey diagram for the TriVersa process shows carbon in biomass flows. Values are in percent, starting with the 100% C molecules in birch wood being used as feedstock.

An interesting detail about this Sankey diagram is that it additionally uses the process “nodes” or “boxes” to indicate operating cost and annualized capital cost. No numbers are given here, but the height of the process box indicates the overall cost (in a kind of stacked bar chart).

EU28 wood flows Sankey diagram

The European research project CASCADES’ objective was “to define the cascading use of wood and assess the environmental and socio-economic impacts of cascading, to identify and analyse the barriers preventing cascading”. As a central element of the project a wood flow analysis was conducted.

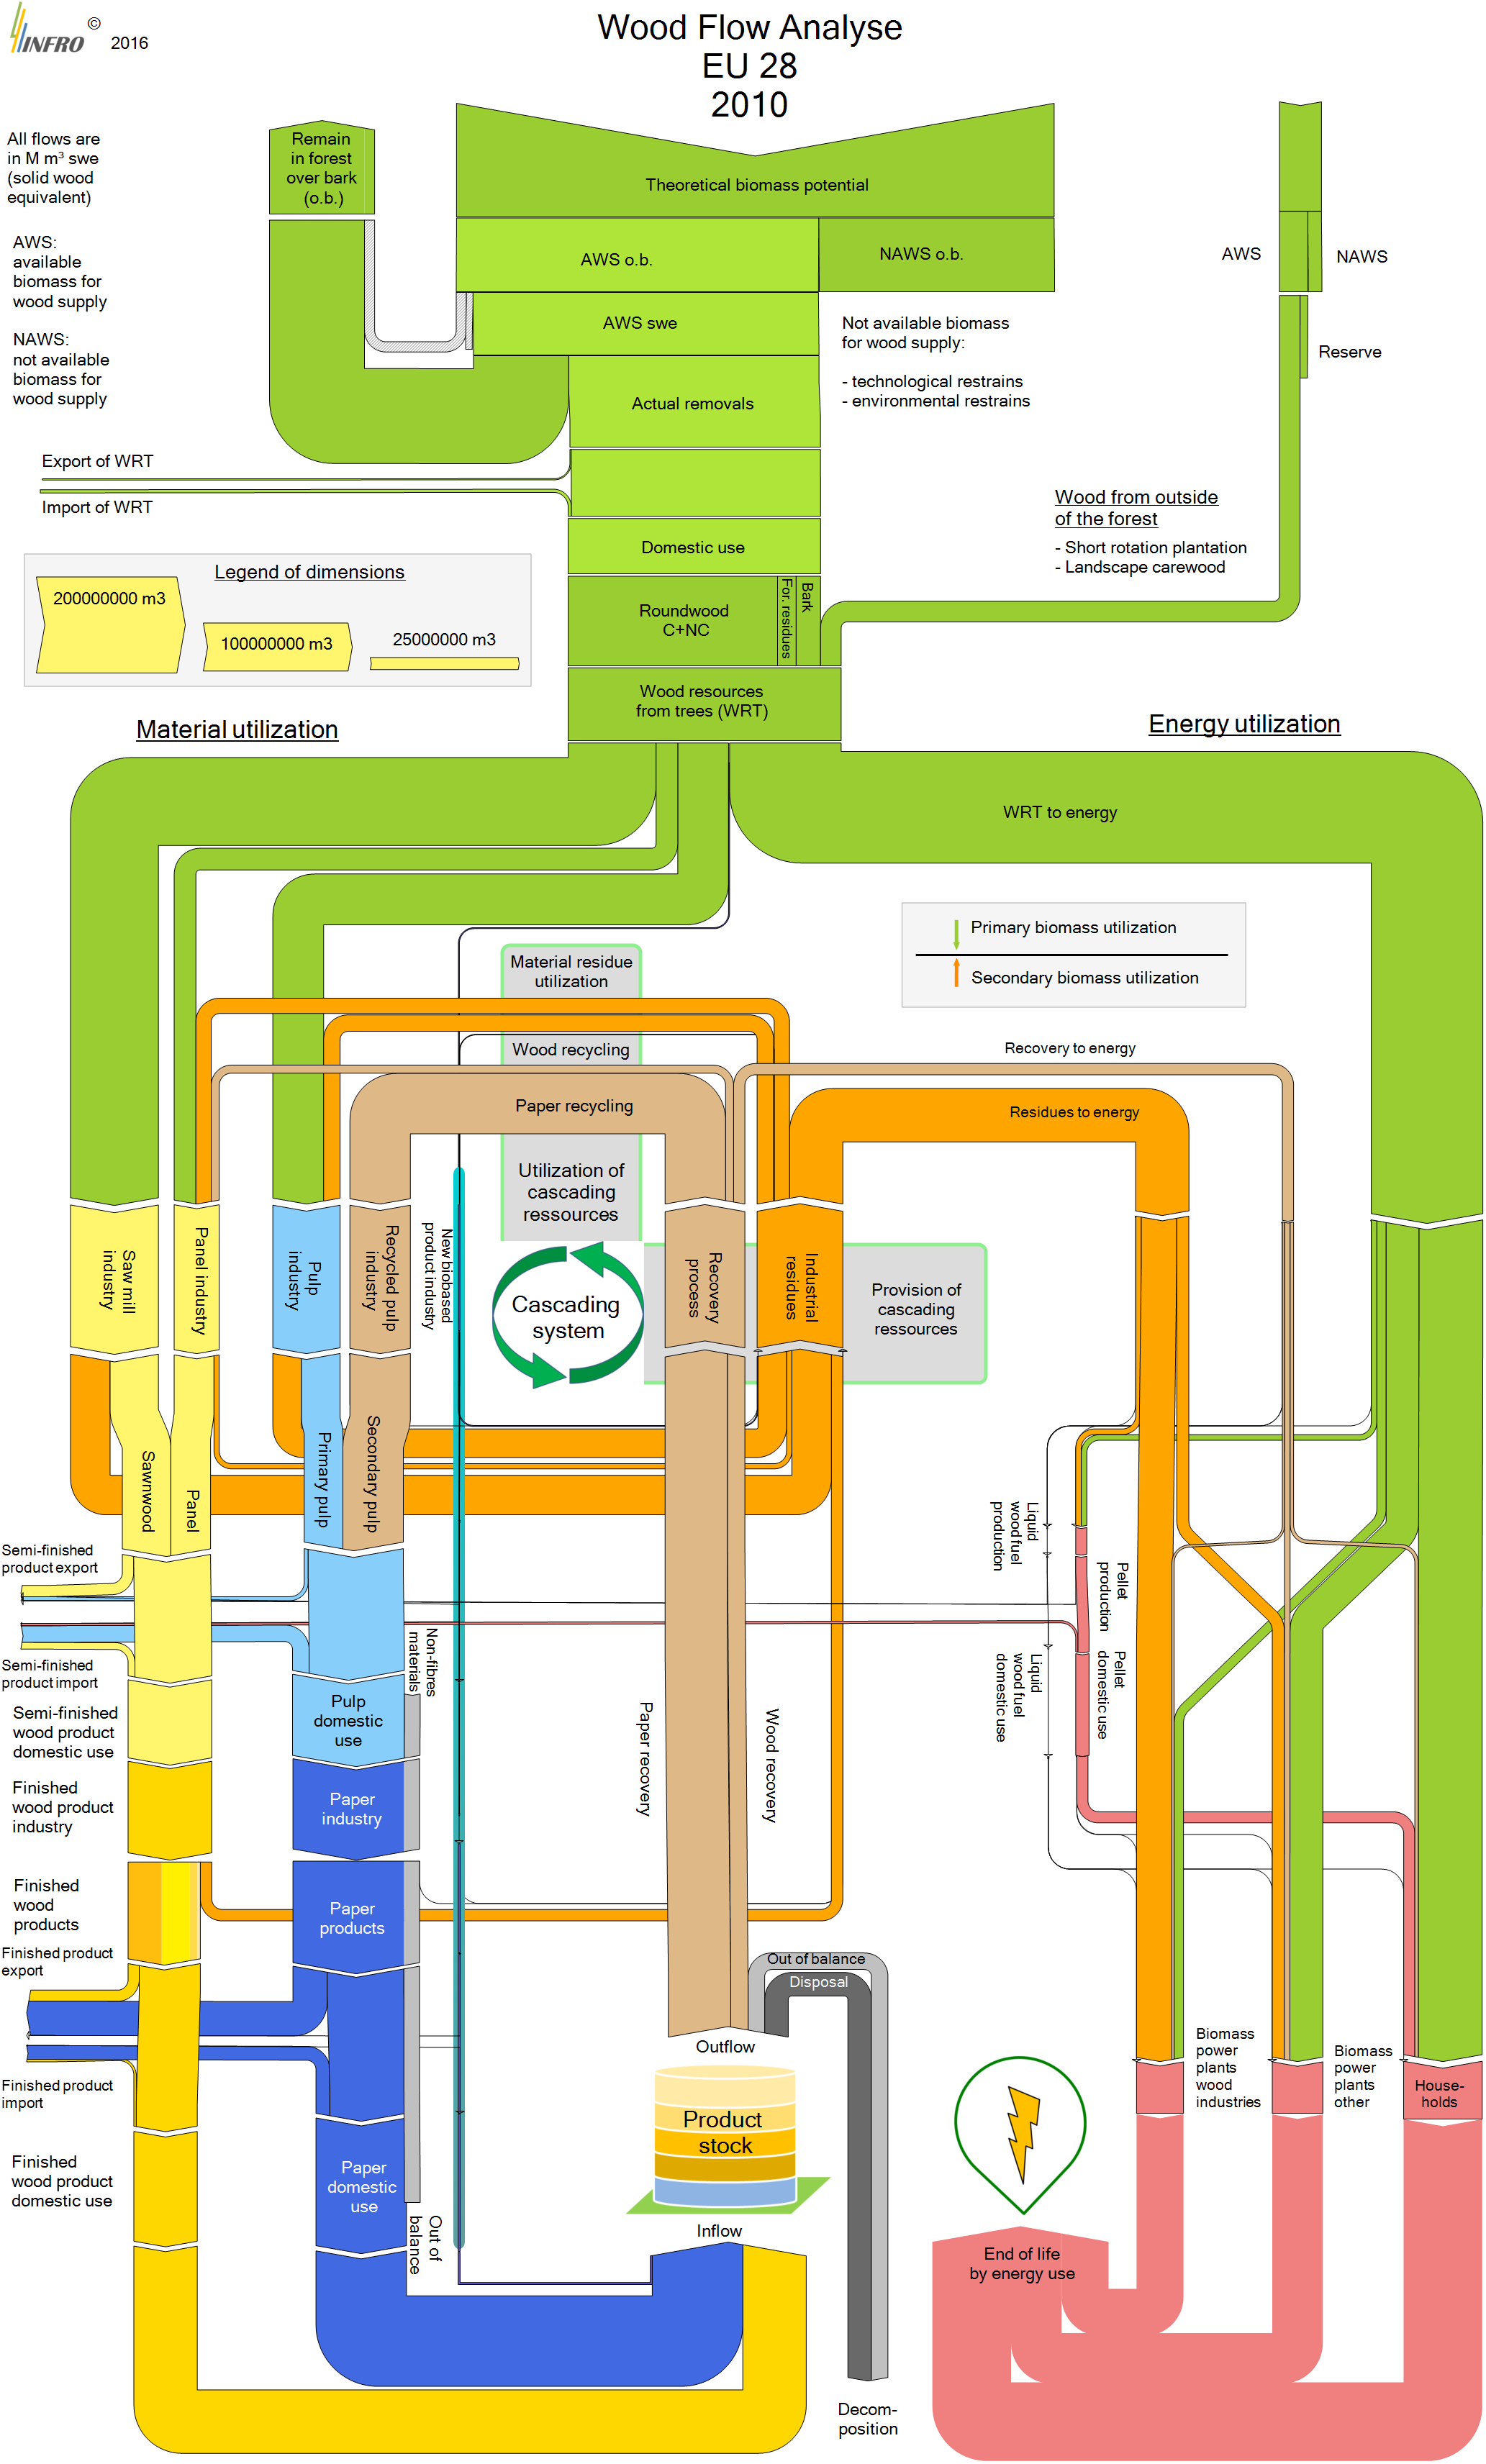
From page 26 the 2016 final report [Vis M., U. Mantau, B. Allen (Eds.) (2016) Study on the optimised cascading use of wood. No 394/PP/ENT/RCH/14/7689. Final report. Brussels 2016. 337 pages)] comes this Sankey diagram depicting wood flows in the European Union (EU-28).

All flows are in Mm³ swe (solid wood equivalent). No absolute numbers are given to quantify the flows, instead three sample arrows serve a reference to the scale (“Legend of dimensions”).

The wood biomass is either used as material (left branches) or as energy (right branch). On the material side wood industry (yellow path) and paper industry (blue path) take up most of the biomass. Residues of both industries along with a good chunk of the post-consumer paper waste are being recovered and led in a cascading loop, until they eventually shift to the energetic side.

A complex and interesting Sankey diagram with much to discover. The CASCADES report describes all the areas of the wood flow system, identifies hotspots and describes measures for optimization.

Yard Waste & Biowaste in Germany

What happens to yard waste and biowaste in Germany? This Sankey diagram from a 2014 PowerPoint presentation titled ‘Flächendeckender Ausbau der Biotonne in Deutschland’ by Peter Krause and Rüdiger Oetjen-Dehne (u.e.c. Berlin) shows how these flows were distributed.

In 2012 there were 14.5 mio. tonnes of yard waste andd 6.6 mi. tonnes of bio waste (kitchen/food waste) were disposed of in Germany. Much of it was collected and treated or – such as in the case of yard waste – composted (7.8 mio. tonnes).

In addition to the absolute quantities the labels along the Sankey arrows show the average per inhabitant (kg/E, a).

A large potential is still in bio waste (orange-coloured arrow) being disposed of in regular household waste (“Restabfall”). Calls for separate collection of bio waste for energy recovery are being made.

Rosenheim wood gasifier more efficient

Interesting comparative Sankey diagram on page 16 of the 2012 environmental declaration of Rosenheim Stadtwerke (Rosenheim City Power?).

The city is building or already running a wood gasification plant. Instead of just using the heat from directly burning wood (with 30% energy loss), they decided to work with a wood gas carburetor and use the wood gas to run a gas motor. This is somewhat similar to CHP where heat and electric power can be produced. Overall loss of energy (“Verluste”) in the system is only 23%.

The green box at the bottom displays the avoided fossil GHG emissions per tonne of wood for both technologies.

Flows are in MWh, but only some selected arrows are labeled. Unfortunately the flows are not always to scale: yellow arrow “Wärme” (heat) in figure at top representing 3,15 MWh, but shown as half the width of the blue arrow 4,5 MWh. I reckon the diagram was build manually from rectangles and triangles.

Biomass 2-in-1 flipped Sankey Diagram

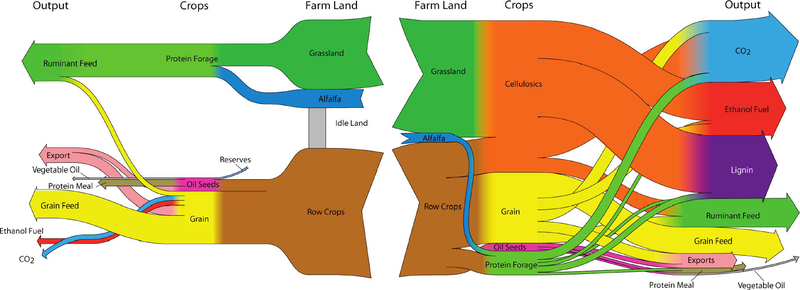
Browsing my previously bookmarked Sankey diagram samples I came across this one which I find interesting. The diagram was shown in a Green Cars Congress blog entry in 2010 and illustrates a study that finds that “large scale biofuel production can be successfully reconciled with food production through the use of land-efficient animal feed technologies and double-cropping”. The authors of the study are Dr. Bruce Dale and colleagues at Michigan State University.

As always I refrain from commenting the underlying content as I am not a domain expert. Rather I would like to focus on what makes this Sankey diagram special.

These are actually two diagrams that are “flipped” over at a vertical center line. The left half of the diagram has a right-to-left orientation and shows the “114 million ha of cropland used now to produce animal feed, corn ethanol, and exports”. Some cropland sits idle and is not used productively. The right half is a second Sankey diagram and shows a different use of the cropland with “major crops and outputs for the maximum ethanol production scenario”. No units in the Sankey diagram but the central columns seems to represent the land area (million ha), while the two outer vertical columns (Crops, Output) show mass (tonnes?) on a different scale.

In contrast to the first scenario it can be observed that “30% of total US cropland, pasture and range, up to 400 billion liters (106 billion gallons US) of ethanol can be produced annually”. Ethanol can be used as an alternative non-fossil car fuel. CO2 emissions are also higher but this is from biogenic sources.

Biochar Slow Pyrolyis Process

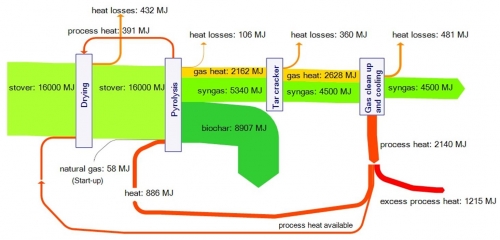
This one is from a presentation (download) by Roberts et.al. from Cornell University titled “Life cycle assessment of biochar production from corn stover, yard waste, and switchgrass” held in in Boulder, CO in August 2009.

I admit it is all new to me and I had to lookup stover and biochar on Wikipedia to understand what it is all about. So, apparently the slow pyrolysis process has several advantages: It works with waste biomass (waste management), it produces biochar that can improve soil, it produces energy (syngas) and it captures carbon.

The Sankey diagram in the presentation shows the energy flows: 16,000 MJ of energy is contained in a tonne of stover; more than a fourth of it can be approved of as syngas from the pyrolysis process. The main objective however seems to be carbon dioxide capture, and biochar presents a viable alternative to other (more energy intensive) carbon sequestration technologies.

The diagram has a slight downwardish slope and some of the arrows have superfluous bends. Heat flows and heat recovery are in orange, losses in yellow, the feedstock and syngas in green.

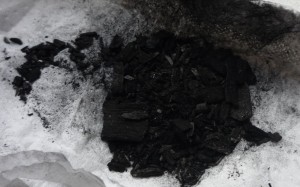
Edit: I received a sample of biochar from a friend. Looks like small pieces of coal indeed. After taking the photo I disposed of the biochar in one of the flower pots on my balcony…

A sample of biochar

Swiss Biomass Sankey Diagrams

Gabor Doka pointed me to a publication by the Swiss EPA (Federal Office for the Environment, FOEN). The publication titled “Biogene Güterflüsse der Schweiz 2006” (‘Flows of biogenic goods in Switzerland in 2006’) features many different Sankey diagrams. “Biogenic goods are defined as goods of biological origin, excluding those of fossil origin”. Data is based on Swiss statistical figures and valid for 2006. Available in German only (Download PDF 7,5 MB).

The overall structure of biomass flows is given in a generic layout and as Sankey diagrams with proportional arrow magnitudes for mass flows (unit is in 1000 tons, based on dry matter) as well as for energy content (in GWh, based on lower heat value of dry matter). These overview diagrams are structured in three columns ‘Production’, ‘Conversion’, and ‘Use/Disposal’. Imports are from top, exports to the bottom. This very clear structure for both mass and energy flows makes the complex diagrams easier to comprehend. These overview Sankey diagrams are available for download as a separate PDF file (still 3,2 MB)
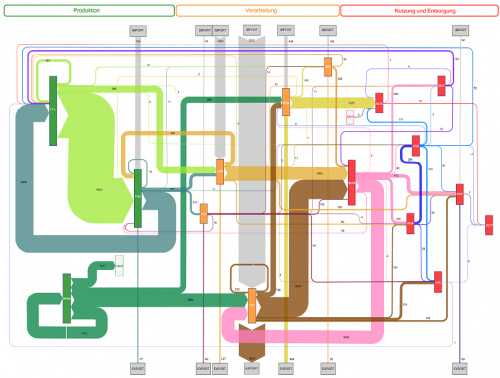
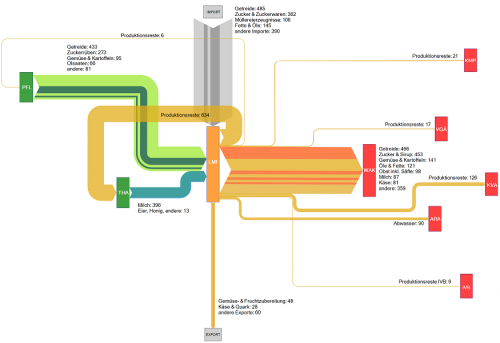
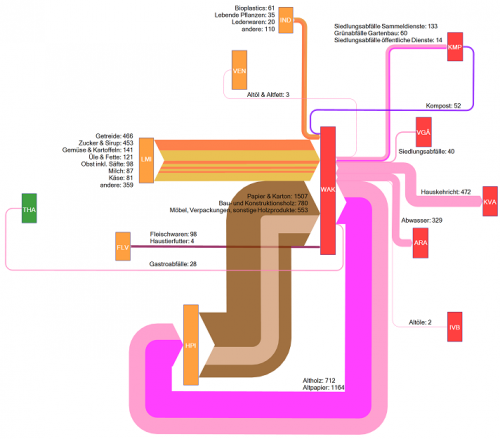
The main diagram is then broken down into individual Sankey diagrams for the different sectors involved, such as plant production (PLB), animal farming (THA), and forestry (WAW) in the production column (orange colored processes), or food industry (LMI) and wood/paper industry (HPI) in the conversion sector (green colored process). Finally, in the use/disposal sector (red colored processes) we find goods consumption (WAK) along with energy generation and waste treatments.

This is the sectoral Sankey diagram for the food industry in Switzerland. We can see that a large part of the biomass for food production is imported, and that most production wastes are fed back into animal farming again. The red boxes are different waste treatments receiving input from the food industry.

The above is the goods consumption section. Main biogenic goods inputs are from food industry and wood/paper industry. The meat input is rather small comparatively. A big chunk of the mass output (namely waste wood and waste paper) feeds back into the wood/paper industry. 472.000 tons ended up in waste incineration that year, some 329.000 tons in waste water.

The Sankey diagrams in the study are interesting to browse and reveal a lot more interesting facts. The stuctured approach with the breakdown into smaller diagrams is very useful. The authors Baier and Baum from ZHAW at Wädenswil have done a great job in compiling this.

“The results of this study will serve as useful decision aids for strategic planning and assessments concerning the potential, use and management of biogenic resources (…) makes it possible to detect quantitative changes that occurred during a given period of time and to reach conclusions concerning the efficiency of measures taken.

Actually this way of visualizing statistical data with directional (from-to) information attached to it could serve as a role model for other national mass and energy accounts, I think.

Uh – this has become my largest post ever 😮 . But I think this was well worth it and the publication merits it. Your comments appreciated.
Biomass Utilization Potential

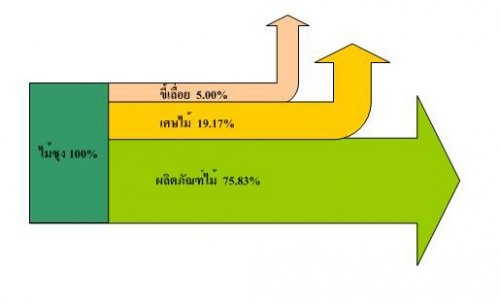
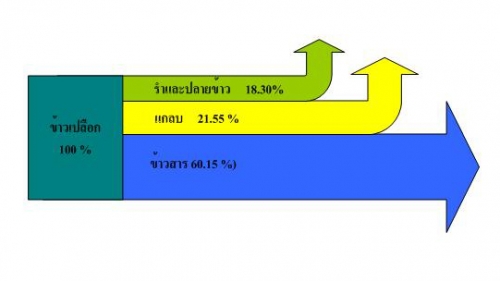
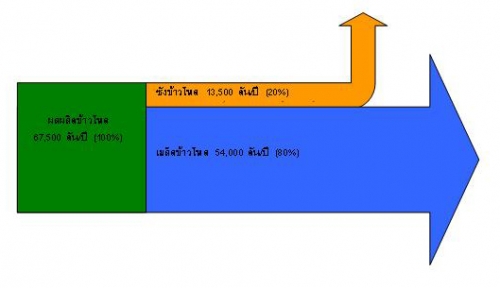
The first Sankey diagrams in Lao language I have come across are from a management summary on “Alternative Energy and Energy Conservation in ACMECS countries”. It shows how much biomass from wood industry, rice mills and other sources is available in the People’s Democratic Republic of Laos as rejects, and could potentially be used for generating energy. All values in tons per year for 2004 or 2005, extrapolated to the whole country from 4 to 6 samples.


Wood Industry: pink arrow is for sawdust, dark yellow arrow for woodbits, summing up to roughly 25%


Rice Mills: green arrow is for rice bran, yellow arrow for husks, summing up to 40%


Corncobs: orange arrow (20%) is corncob reject that could potentially be used for energy generation.

Even though I don’t read or write Thai, I love those letters. For those of you who wish to read the summary in English (with only 2 Sankey diagrams), a translation is available. Update Nov 2008: Unfortunately the website http://www.dede-acmecs.com has gone offline