Tag: heat

Cleaning out: a 2011 Sankey goodie

As I am cleaning out my office – throwing away old notes, brochures and journals – I came across a November 2011 copy of German ‘UmweltMagazin (Environment Magazine). It has this Sankey diagram in an article on CO2-neutral steam generation for bioethanol production.


This Sankey diagram is in German. Flows are kW. This is for a small-scale plant at an agricultural business and heat is used for a destillation unit. The input feed to the steam boiler is primarily off-heat from a CHP plant fired with biomass. Losses are shown as grey arrows, steam as lilac arrows and heat in red. Condensate recovered at the heat excanger is fed back into the steam boiler (green loop).

Sorry for the quality of the scan. And Happy New Year to all of you! Will be back in 2019 with more Sankey diagrams.

Building Energy, Simple Sankey Diagrams

From my collection of Sankey diagrams here are three very similar samples depicting energy flows in a building. All three are from Germany (did I mention that more than half of the Sankey diagrams seem to be from Germany or Austria?).

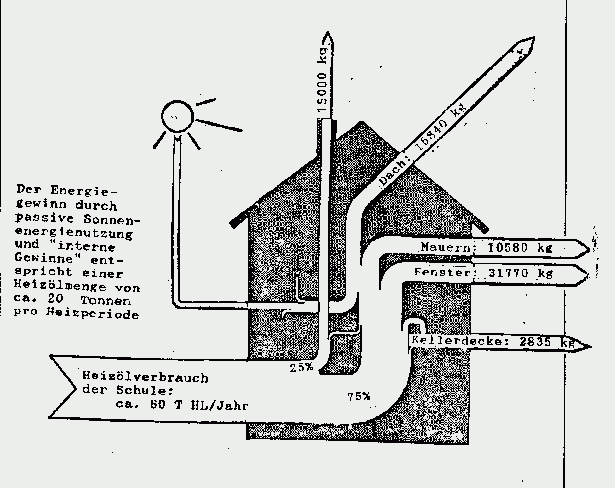
These are all very simple Sankey diagrams. This first one is a hand-drawn goodie from the times when reports were still done with a typewriter. It shows use of fuel oil (‘Heizol’) in a school building, and interesting to see, the flows are given in kilograms fuel oil rather than to represent the heating value. The school building consumes 80 tonnes of fuel oil per year.

Note that flows are not to scale (arrow for equivalent of 10580 kg fuel oil annual heat loss through walls is about the same width as the one representing 31770 kg heat loss through windows). So this Sankey diagram doesn’t deserve an A…


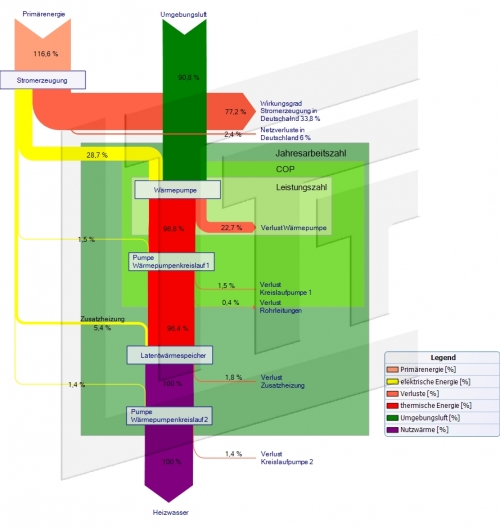
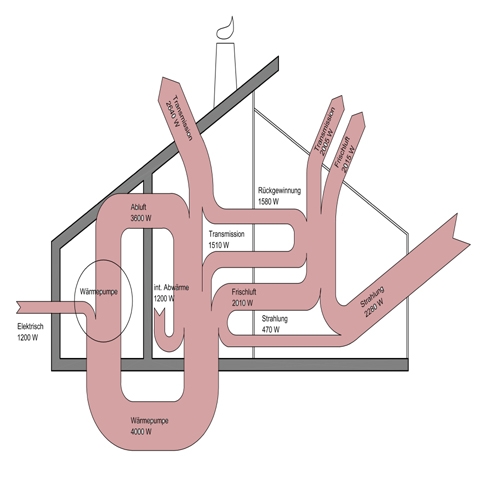
The next building energy flow Sankey diagram shows flows in Watts (W). Not sure where I found this one. Flows again are not proportional (spot the 470 W flow and compare it to the others). Main inputs are radiation (‘Strahlung’) and electric energy. A heat pump cycling energy can be seen, so it seems that this one is maybe for a passive house.

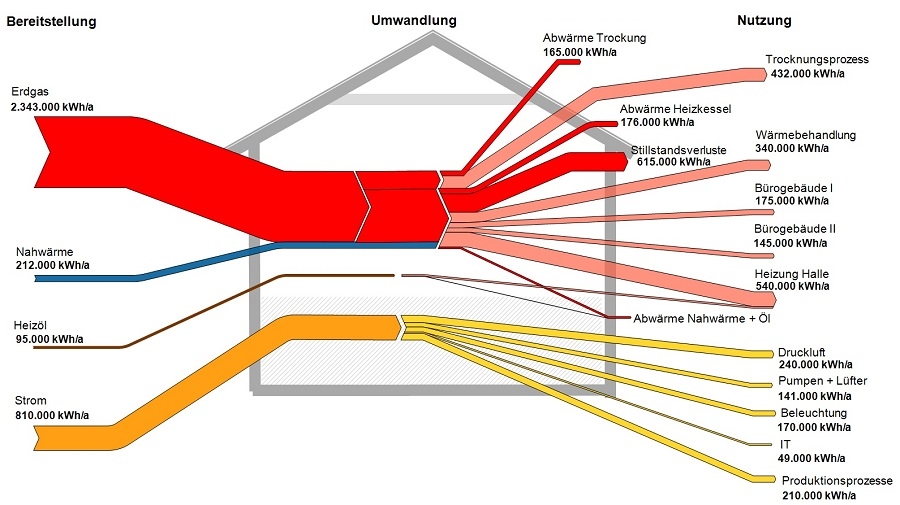
This last one done with a Sankey diagram software hence flows are to scale in this one (although I have some doubts regarding the width of the fuel oil input arrow on the left). Flows are in kWh per year. Main fuel type is natural gas (red), some district heating (blue). Electric energy in yellow, consumed by IT, lighting, air compressors, and so on. This energy flow Sankey diagram is probably for a factory building or complex.

I will try to add the sources where I found these three diagrams. Please forgive my negligence this time.
Heat Flow Retro Sankey Diagram Remake

‘Dubbel’s Handbook of Mechanical Engineering’ could be considered a bible for mechanical engineering students in Germany. Despite its 900 pages it is still called a pocket book (‘Dubbel – Taschenbuch für den Maschinenbau’) in German quite euphemistically. Since it was first published in 1914 by Heinrich Dubbel it has seen some 24 editions and roughly 920,000 copies sold. Since 1994 it is also available in an English translation from Springer Publishers.


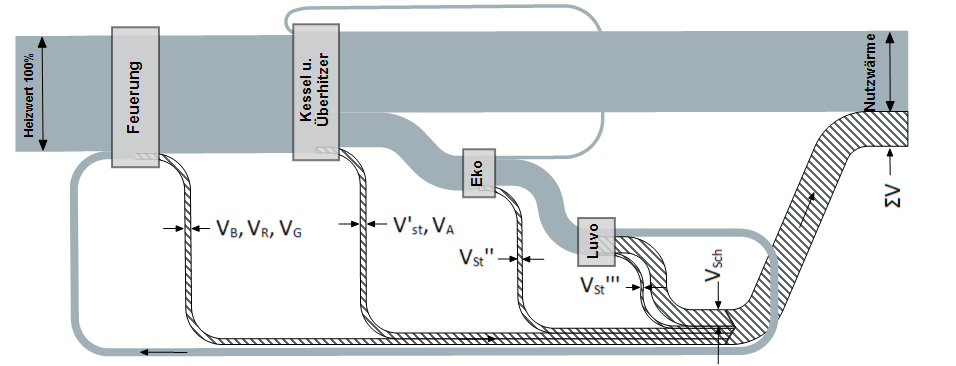
Someone challenged me, if I could do the above figure from Dubbel’s book (“Wärmestrom in einer Kesselanlage”, heat flow in a boiler system). I did various copies and here are the two I like best:

In this version losses are shown in grey with a gradient to dark grey.

The other one sticks closer to the original with the hatch pattern on the arrows representing losses. I had to fill the nodes since the contrast between the colored arrows and the hatched arrows was just too harsh.

I confess I couldn’t do the labels with prime marks and subscript directly in e!Sankey. So I did them in Word, created tiny images and rotated them as work around. Later I found out that the whole image was probably originally intended to be displayed vertically, but rotated to the left only to save space in the book.

Anyway … a fun challenge. I hope you like the result. Let me know your opinion.

Visualizing Internal and External Heat Flow

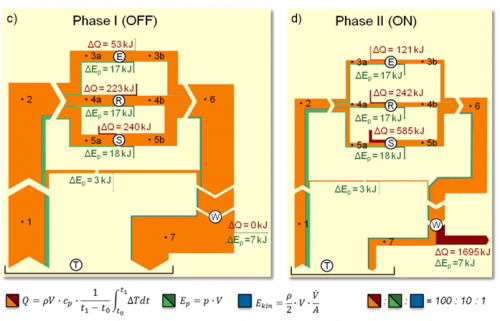
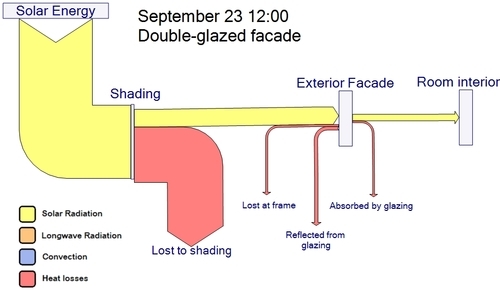
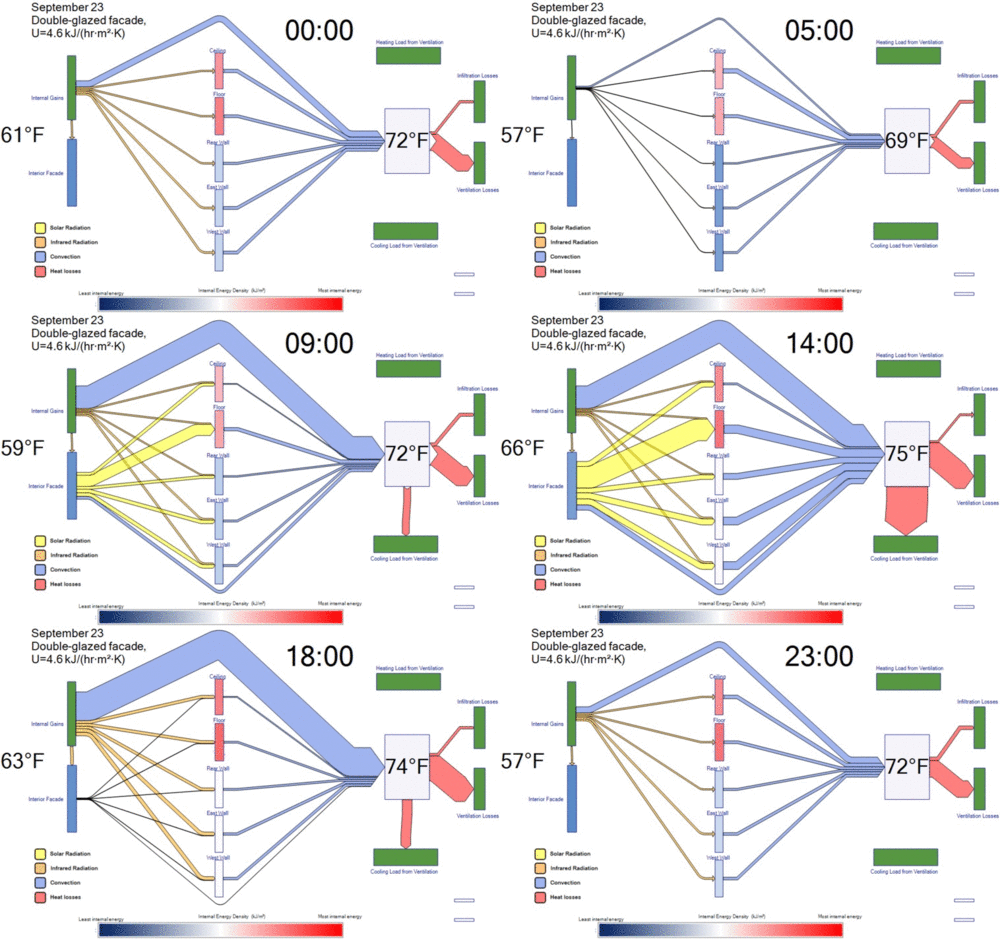
This post on the Transsolar ‘Green & Sexy’ blog features two Sankey diagrams. The “climate engineers” at Transsolar use them to model heat flows inside a building based on outside temperature and solar radiation.

No absolute values are given in these demo Sankey diagrams, but one can still get a general idea by observing proportions. Flows are color-coded with solor radiation in yellow, convection in blue, and heat losses in red.

The second Sankey diagram shown is a timeline made 24 frames – one per hour over a full-day. As the outside temperature rises and solar radiation increases around noon, the inside temperature and cooling demand increases.

(via tumblr)

Sankey diagram timeline by Transsolar

The authors explain:

“These Sankey diagrams allow us to see the proportion of how much energy is hitting the facade, how much energy is being radiated into the walls, how much energy is being convected into the air, and how much heating or cooling is actually needed to maintain an acceptable indoor air temperature. The animation is the first example we’ve ever seen of a Sankey diagram that represents the dynamic, ever-changing relationship of heat flows in a building with time.”

Rosenheim wood gasifier more efficient

Interesting comparative Sankey diagram on page 16 of the 2012 environmental declaration of Rosenheim Stadtwerke (Rosenheim City Power?).

The city is building or already running a wood gasification plant. Instead of just using the heat from directly burning wood (with 30% energy loss), they decided to work with a wood gas carburetor and use the wood gas to run a gas motor. This is somewhat similar to CHP where heat and electric power can be produced. Overall loss of energy (“Verluste”) in the system is only 23%.

The green box at the bottom displays the avoided fossil GHG emissions per tonne of wood for both technologies.

Flows are in MWh, but only some selected arrows are labeled. Unfortunately the flows are not always to scale: yellow arrow “Wärme” (heat) in figure at top representing 3,15 MWh, but shown as half the width of the blue arrow 4,5 MWh. I reckon the diagram was build manually from rectangles and triangles.