From my collection of Sankey diagrams here are three very similar samples depicting energy flows in a building. All three are from Germany (did I mention that more than half of the Sankey diagrams seem to be from Germany or Austria?).
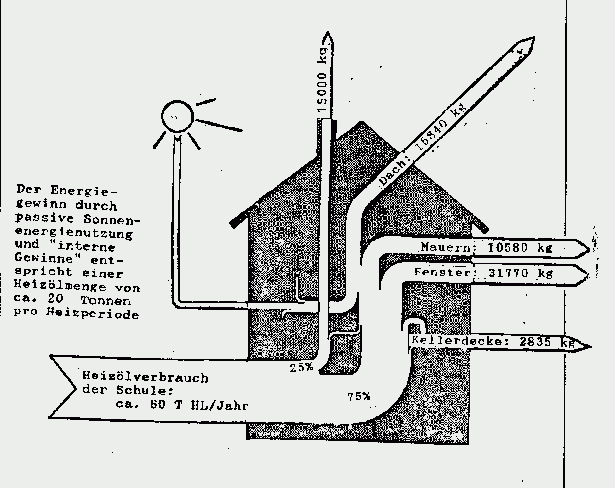
These are all very simple Sankey diagrams. This first one is a hand-drawn goodie from the times when reports were still done with a typewriter. It shows use of fuel oil (‘Heizol’) in a school building, and interesting to see, the flows are given in kilograms fuel oil rather than to represent the heating value. The school building consumes 80 tonnes of fuel oil per year.
Note that flows are not to scale (arrow for equivalent of 10580 kg fuel oil annual heat loss through walls is about the same width as the one representing 31770 kg heat loss through windows). So this Sankey diagram doesn’t deserve an A…
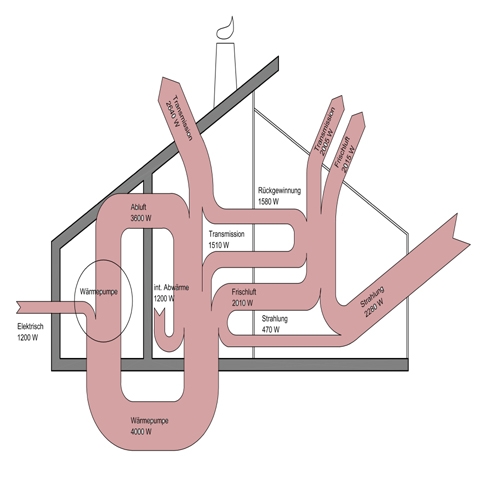
The next building energy flow Sankey diagram shows flows in Watts (W). Not sure where I found this one. Flows again are not proportional (spot the 470 W flow and compare it to the others). Main inputs are radiation (‘Strahlung’) and electric energy. A heat pump cycling energy can be seen, so it seems that this one is maybe for a passive house.
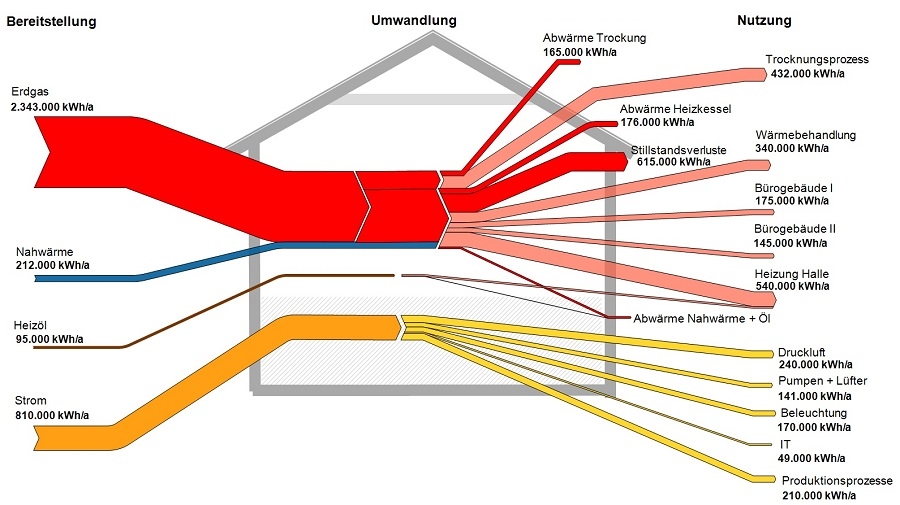
This last one done with a Sankey diagram software hence flows are to scale in this one (although I have some doubts regarding the width of the fuel oil input arrow on the left). Flows are in kWh per year. Main fuel type is natural gas (red), some district heating (blue). Electric energy in yellow, consumed by IT, lighting, air compressors, and so on. This energy flow Sankey diagram is probably for a factory building or complex.
I will try to add the sources where I found these three diagrams. Please forgive my negligence this time.


