Category: Methodology

Sankey Diagrams in Excel

Mark over at the Excel Off The Grid blog has a great new post on how to ‘Create a Sankey diagrams in Excel’.

Mark shows how to build a simple 2 category relationship diagram by using stacked area charts and reversed stacked bar charts. By layering the individual charts with mostly transparent colors (except the actual arrow), he manages to get a very neat diagram. It even allows changing the spacing between the start and end nodes, as well as the segment length of the horizontal first and and last arrow segment.

That is ‘big ass’-Excel usage!! Check out this video to see how the source data is prepared (some SUMIFs involved here) and the Sankey diagram is made. It is well worth watching all 18 minutes, in my opinion.

And if you want to try it out, you can download the template and start building from there. Read Mark’s post here.

Material Flows and Value Streams in Mining

A news item reporting on a 2019 workshop on sustainability assessment by Liesbeth Horckmans (VITO) also makes mention of findings in the European research project METGROW+. What caught my eye were two Sankey diagrams from the field of mining and metals production.


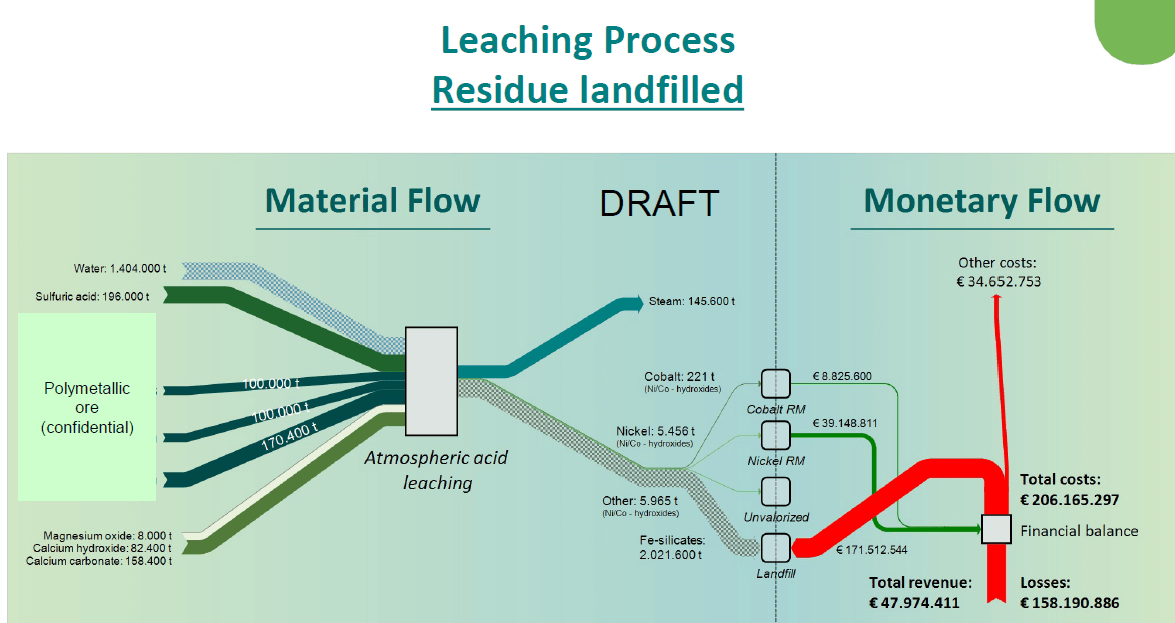
(Source METGROW+ Project via Crocodile project news page)

The Sankey diagram is interesting in two ways. First, these are actually two Sankey diagrams, touching each other at the nodes along the dotted ‘cut here’ line. The left part shows material flows in mining and metals production. From the tailings that typically end up on a landfill, nickel and cobalt are recovered. The right part visualizes the value streams linked to metal recovery and and costs associated with the landfill. These “monetary flows” are shown in red (if it is an expense) and in green (if it is a revenue). They run in opposite directions and are connected at the “Financial Balance”.

A second Sankey diagram (not shown here) compares this to a situation, where the Fe silicates typically sent to landfill can actually be “valorised” and fed back into the material cycle. In this case the financial balance can actually show a profit.

The second interesting aspect of this Sankey diagram is the way they handle flows that are out of scale (an issue I am particularly wary about, as some of you might have noticed).
In the mining and metal production process the water quantity being used is threefold the materials quantity, so the water flow would normally be three times the width of all the other flows in the Sankey diagram, if they were to scale. Here, the authors opted instead to mark the flow with a pattern and also use a pastel color to signal that this flow is not to scale.
The same on the output side, where we see the tailings stream (2 million tonnes) that is much much larger than the green recovered metals flows. If you were to draw these flows to scale, the arrow to ‘Landfill’ would be many times wider, and most likely spoil the whole diagram. Instead they opted to draw it in light grey with a moiree pattern. …

Loopbacks in Sankey Diagrams

My previous post on circular links got a number of responses. Indeed it seems as if drawing loopbacks (as I prefer to call them) is one of the tougher challenges in Sankey diagrams.

  • Loops back to the same node are typically not required in relationship diagrams (bands depicting relationship between categories, see here), but they may be necessary if you want depict actual physical flows (e.g. recycling of material)
  • Direct loops back, where the output of a process leads directly back to the same node, are not very common (one example can be seen here, called “functional recycling”). There could be in reality a node along the way back (e.g. a pump that pumps cooling water cycling the process). If you have a node in the loopback, then the input and output side are flipped.
  • Loops can “go back via several nodes, they may even branch on the way back” like in the example below


If you take a left-to-right column oriented approach when setting up the diagram working with tabulated data as the source (sth like “source”: “process3”, “target”: “process8”, “value”: 20) then you have to consider the column depth to identify whether you have a back loop. All sorts of routing issues for the arrow come up and you need to create room to not produce overlaps. Drawing the Sankey diagram manually (like I did i the figure above) rather than programmatically gives more freedom in that respect.

Sankey Diagrams for Expressing Relevance

SaraVaca is a specialist on evaluation and data visualization. She runs the VisualBrains blog (check out the visuals CVs section!).

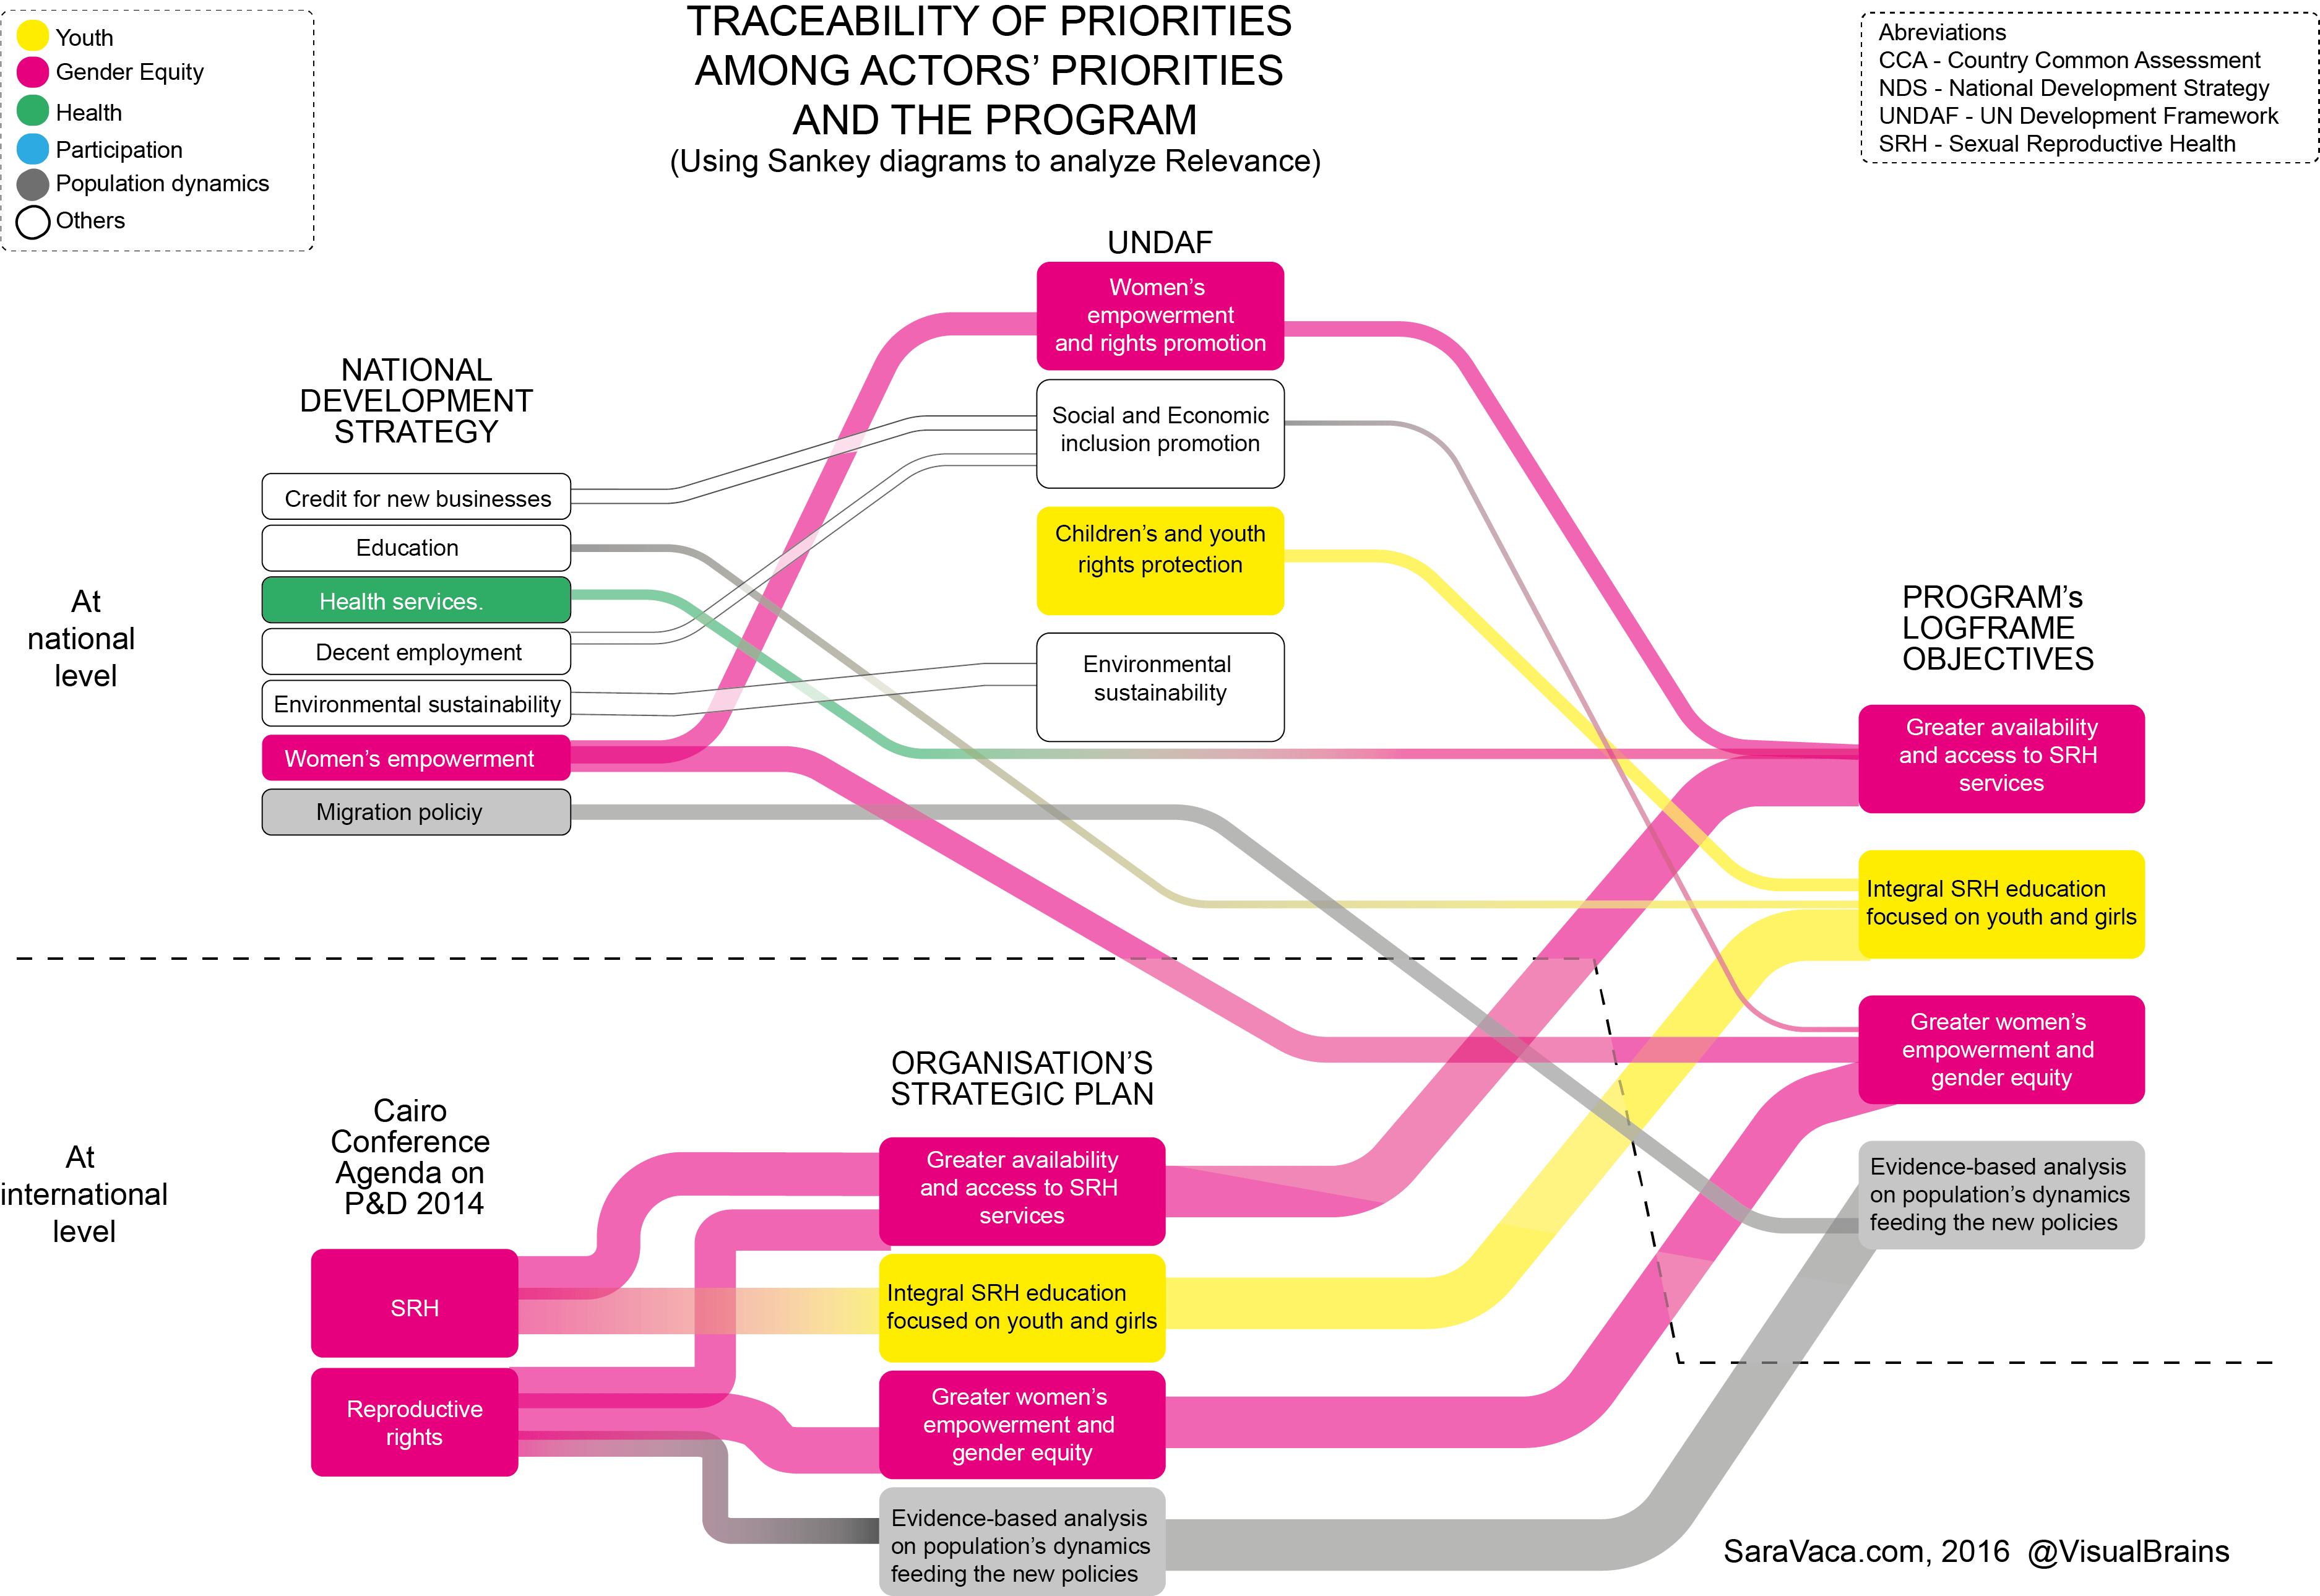
In a 2016 post she discussed using Sankey diagrams to express “Relevance” in evaluation. Having in mind a quantifiable flow perspective in Sankey diagrams, I was not sure how relevance could be translated. “Relevance in Evaluation is understood as the extent to which the aid activity is suited to the priorities and policies of the target group, recipient and donor”, she explains. So for a Sankey diagram that would mean expressing the “extent” or “suitability” in numbers. Which can of course be done either by assigning weight criteria or doing an ABC analysis.

Here is Sara’s sample:

We can see bands of four different widths. Additionally there is a color-coding for different categories for which the relevance is measured. Interesting approach. In 2017 she followed up with a post on ‘More inclusive (Sankey) diagrams to analyze Relevance’.

Sankey Charts in Tableau

Found an interesting blog post over at TabVizExplorer, a casual blog maintained by Mithun Desai. Data visualization is one focus of his work.

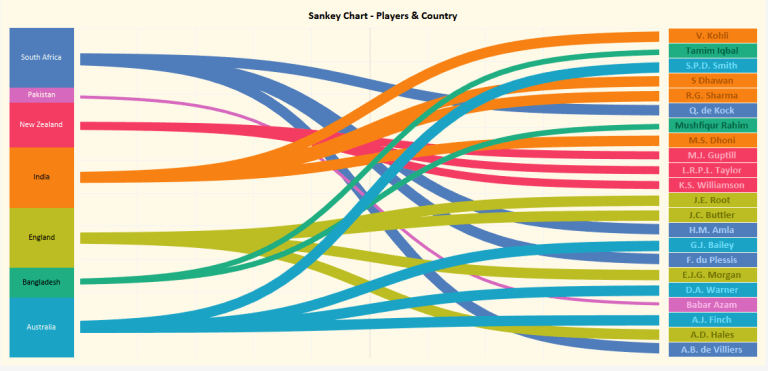
He uses Tableau to draw Sankey charts (I prefer to call them relationship diagrams, alluvial diagrams or even Spaghetti diagrams). Here is a rather simple one, showing the relation between top 20 cricket players and their country of origin.


The diagram has two data categories. The country of origin shown in the left stacked column in no particular order, and the top 20 players ordered according to their ICC ranking score.
In between are the streams or bands (or ‘Spaghettis’ for the sake of it) color coded by country of origin.

Now, it is not up to me criticizing the choice of diagram type for conveying this specific information. The author seems to have chosen the cricket topic just as a sample, to explain how to do Sankey charts in Tableau in general. Actually the colored list of top 20 (right column) already tells us all we need to know and you wouldn’t even need the left column and the streams.

The main reason I am not happy with this diagram is the fact that it does not stick to the most important characteristic of a Sankey diagram. The post itself comes with the definition: “Sankey diagrams are specific type of flow diagram in which the width of the arrows is shown proportionally to the flow quantity.”

So, what is the flow quantity here? I was thinking of net worth in $$$ of each player, or at least a translation of the ranking score to the width of the bands. But then Babar Azam, who ranked 4th with a score of 846 wouldn’t be shown with a band narrower than the one of E.J.G.Morgan coming in 20th with a score of 650. My guess is, that the the widths of the streams are chosen deliberately…

Where the bands merge, they overlap rather than merge to show the sum of the flow quantities. This makes for a very odd visual effect, at least in terms of Sankey diagrams.

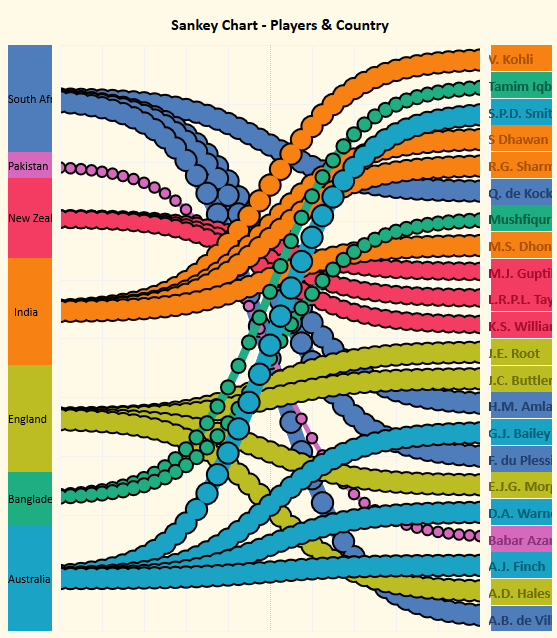
The blog article gives away some of the math behind the curves, so called Sigmoid curves, which is interesting.


This capture taken from the embedded Tableau graph shows how the curves are made up and how the width is maintained along the routing of each curve: You do it with cricket balls 😉 … or christmas bulbs.

Other implementations of relationship diagrams use Beziers curves (which sometimes come with another downside, read here). But that’s for another time…
Handling Different Scales in one Diagram

Those of you who have already created Sankey diagrams might have come across the issue: As long as the flow data you are about to visualize is more or less in the same value range everything is fine, and there should be no problem in coming up with an nice Sankey diagram. However, sometimes we have very small flow quantities, while at the same time there are some large flows dominating the picture.

Sticking to the “golden rule” of Sankey diagrams (i.e. the width of the Sankey arrow corresponds to the flow quantity represented) and ensuring the proportionality of flows in relation to each other becomes very difficult. If you opt to show the larger flows at “normal” width, the smaller flows become difficult to perceive and are shown as hairlines (sometimes even invisible on a screen or in print). If, on the other hand, you decide to push up the scaling factor so that these smaller flow quantities can be seen in the diagram, then the large flows are really fat and spoil your diagram.

This seems to be an irresolvable issue… Nevertheless, there are some approaches to tackle this. Most of them resort to taking out the tiny flows or the very large flows of being to scale used in the Sankey diagram. You may opt to use a minimum width (e.g. 1 or 2 pixels) for arrows that carry only a small flow quantity, or you may decide to set an upper flow threshold, corresponding to a maximum width for the Sankey arrow, independent of the actual flow quantity (beyond the threshold value). In both cases I would strongly recommend to denote this decision in the diagram (e.g. in a footnote), since otherwise the person looking at the Sankey diagram will get a wrong idea of the quantities/proportions.

The Sankey diagram from the PROSUM report I recently featured in this post has another, quite unique solution. Here is a zoomed cropped section:

The metals in the end-of-life vehicle (ELV) stream of 8 million tons (in 2016) are mainly aluminium, copper and iron. This stream is on the same scale as the overall Sankey diagram (see full diagram here). However, the other metals in the stream (such as gold, silver or platinum) are contained in comparatively much smaller amounts. The authors of the Sankey diagram hence opted to emphasize them by switching to another scale (1:5.000). As a result the arrow representing the flow of approximately 660 tons of critical raw materials (CRMs) is almost a wide as the arrow that shows 6780 ktons!

The fact that the precious metal stream is highlighted and not to scale with the rest of the flows in the diagram is clearly signalled with a note, a dotted line that separates this diagram area, and even an exclamation mark symbol.

Since CRMs were the focus of the PROSUM study I think such a “trick” is justified. What are your experiences with flows on different scales? How would you handle this “dimension challenge” in a Sankey diagram? Let me know your ideas!

Landscapes of Climate Finance, I4CE

What is landscape of climate finance? A paper published December 2016 by I4CE tells us that “Landscapes of climate finance are comprehensive studies mapping financial flows dedicated to climate change action and the energy transition. Covering both end-investment and supporting financial flows from public and private stakeholders, [they] draw the picture of how the financial value chain links sources, intermediaries, project managers and the end investment.”

The paper by Hadrian Hainaut (I4CE), Andreas Barkman (EEA) and Ian Cochran (I4CE) titled ‘Landscapes of domestic climate finance in Europe: Supporting and improving climate and energy policies for a low-carbon, resilient economy’ features two interesting Sankey diagrams.

This is the ‘Landscape of Climate Finance in France 2014’:


Flows are in billion Euro. Sources and receiving sectors indicated with distinctive black boxes. The authors opted for strictly horizontal/vertical arrow routing. There are no individual quantities at each arrow, so the actual numbers can only be estimated from the arrow proportions.

This is the ‘National Climate Finance in Belgium 2013’:


Flows are in million Euros. Some muddle here at the exit of the top light blue box where the arrows overlap instead of showing the sum of roughly 2000 m€ spending. This coincides with three overemphasized arrow heads for the arrows leading to “Public Investments”, “Policy Incentives” and “Grants”. Arriving arrows at the box “Climate Mitigation” overlap and the Sankey diagram could benefit from clearing up here.

Not sure about the ESDC voting: “France: huit points, La Belgique: dix points” maybe 😉

I had reported on climate finance diagrams back in 2014 when the concept was first presented by Climate Policy Initaitive (CPI) but had since lost sight of them. I am happy to see that the idea is still alive and being taken up in a number of countries in Europe. Also good to see that the diagrams are not yet regulated by a standard and there is some “diversity” among these diagrams.

Cape Town Water Use Sankey Diagram

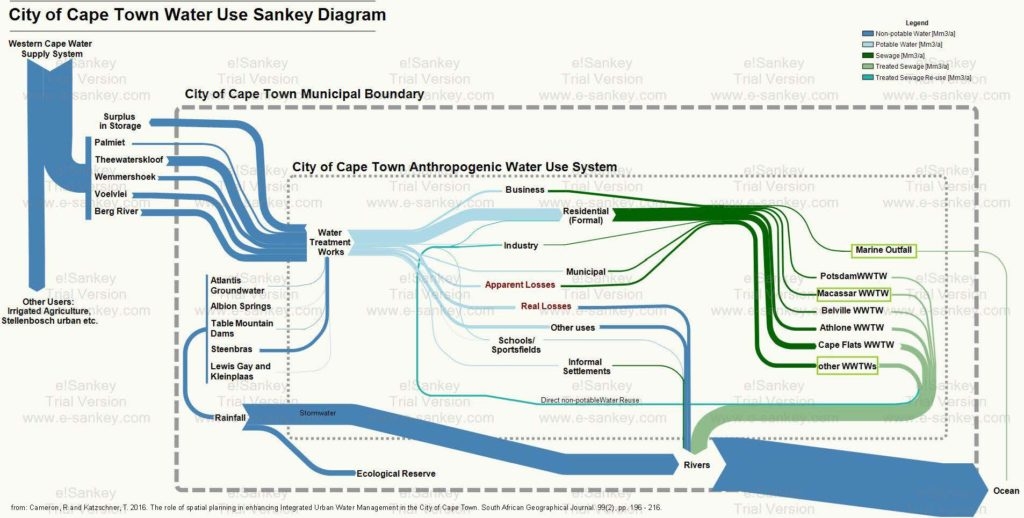
From a post ‘Cape Town’s water crisis : Towards a more water secure future’ on the Future Cape Town blog comes this Sankey diagram on the water use in the city of Cape Town (South Africa).

The author of the diagram, Rebecca Cameron, is with MCA Urban and Environmental Planners and looks at how Cape Town could transition towards a more water secure future. This Sankey diagram was originally published in her article Cameron, R and Katzschner, T. 2016. The role of spatial planning in enhancing Integrated Urban Water Management in the City of Cape Town. South African Geographical Journal. 99(2), pp. 196 – 216.

Absolute flow values are not given in this version of the Sankey diagram. Flows are in million cubic metres per year (Mm³/a). Water from five different sources outside the municipality feed the city of Cape Town, as well as five sources within the city. A breakdown of water supplied by the municipal water works is shown. Additional color coding of the arows indicate water quality (dark green = sewage, light green = treated water).

The author explains:

“This diagram is helpful in that it places all aspects of the water system in to one diagram. Here, water supply, water use, wastewater treatment and stormwater have been considered as a single system where too often the urban water cycle is fragmented when addressed within different sectors. The arrows of flow follow a key to represent the quantity and quality of water. The size of the arrow of flow is proportionally indicative of the quantity of water that flows from one process to one another. The colour of the arrows indicates the quality of the water flow; this includes non-potable, potable, sewage, treated sewage, and treated sewage for reuse. This is important to represent as, to intervene in an urban water cycle, both quantity and quality of water must be considered and used appropriately to move towards a more efficient and sustainable water system.”

From the rivers most of the water goes to the ocean. Through evaporation and precipiation it (hopefully) replenishes the reservoirs again that feed the city (this last part not shown in the diagram).