Tag: Netherlands

Wood Biomass in The Netherlands

This Sankey diagram on wood biomass flows in the Netherlands is featured in the study ‘Sustainable biomass and bioenergy in the Netherlands’ by Goh, Mai-Moulin and Junginger from Utrecht University.


Flows are in million tons (MT) dry mass for the year 2014. The diagram has a very clear structure. Import streams are from the top and exports leave to the bottom. Domestic Dutch production is from the left, use of wood biomass in the Netherlands is to the right. Paper and cardboard, alongside pulp are the largest flows, but mainly being imported and exported again, or circulating domestically as recycled paper.

The report has two other Sankey diagrams on oils and fats and carbohydrates used in different sectors in the Netherlands. See the full report here.
Biomass and Bioenergy in The Netherlands

The study ‘Sustainable biomass and bioenergy in the Netherlands’ was carried out by researchers Goh, Mai-Moulin and Junginger from Utrecht University in the framework of the Netherlands Programmes Sustainable Biomass. It looks at “biomass from the three major categories, i.e. woody biomass, oils and fats and carbohydrates used in different sectors in the Netherlands”.

For each of these three categories a Sankey diagram is presented, like for example this one for oils and fats.


The diagram has a very clear structure. Import streams are from the top and exports leave to the bottom. Domestic Dutch production is from the left, use of oils and fats in the Netherlands is to the right. Flows are in million tons (MT) dry mass. Data is for the year 2014.

See the full report here.

Waste Water Treatment Plant Sankey

An area of application for Sankey diagrams that has (so far) received little attention here on the blog is waste water treatment. The article ‘Nitrogen Recovery from Wastewater: Possibilities, Competition with Other Resources, and Adaptation Pathways’ by Van der Hoek, J.P.; Duijff, R.; Reinstra, O. In: Sustainability 2018, 10(12), 4605 has two Sankey diagrams that merit being featured here.

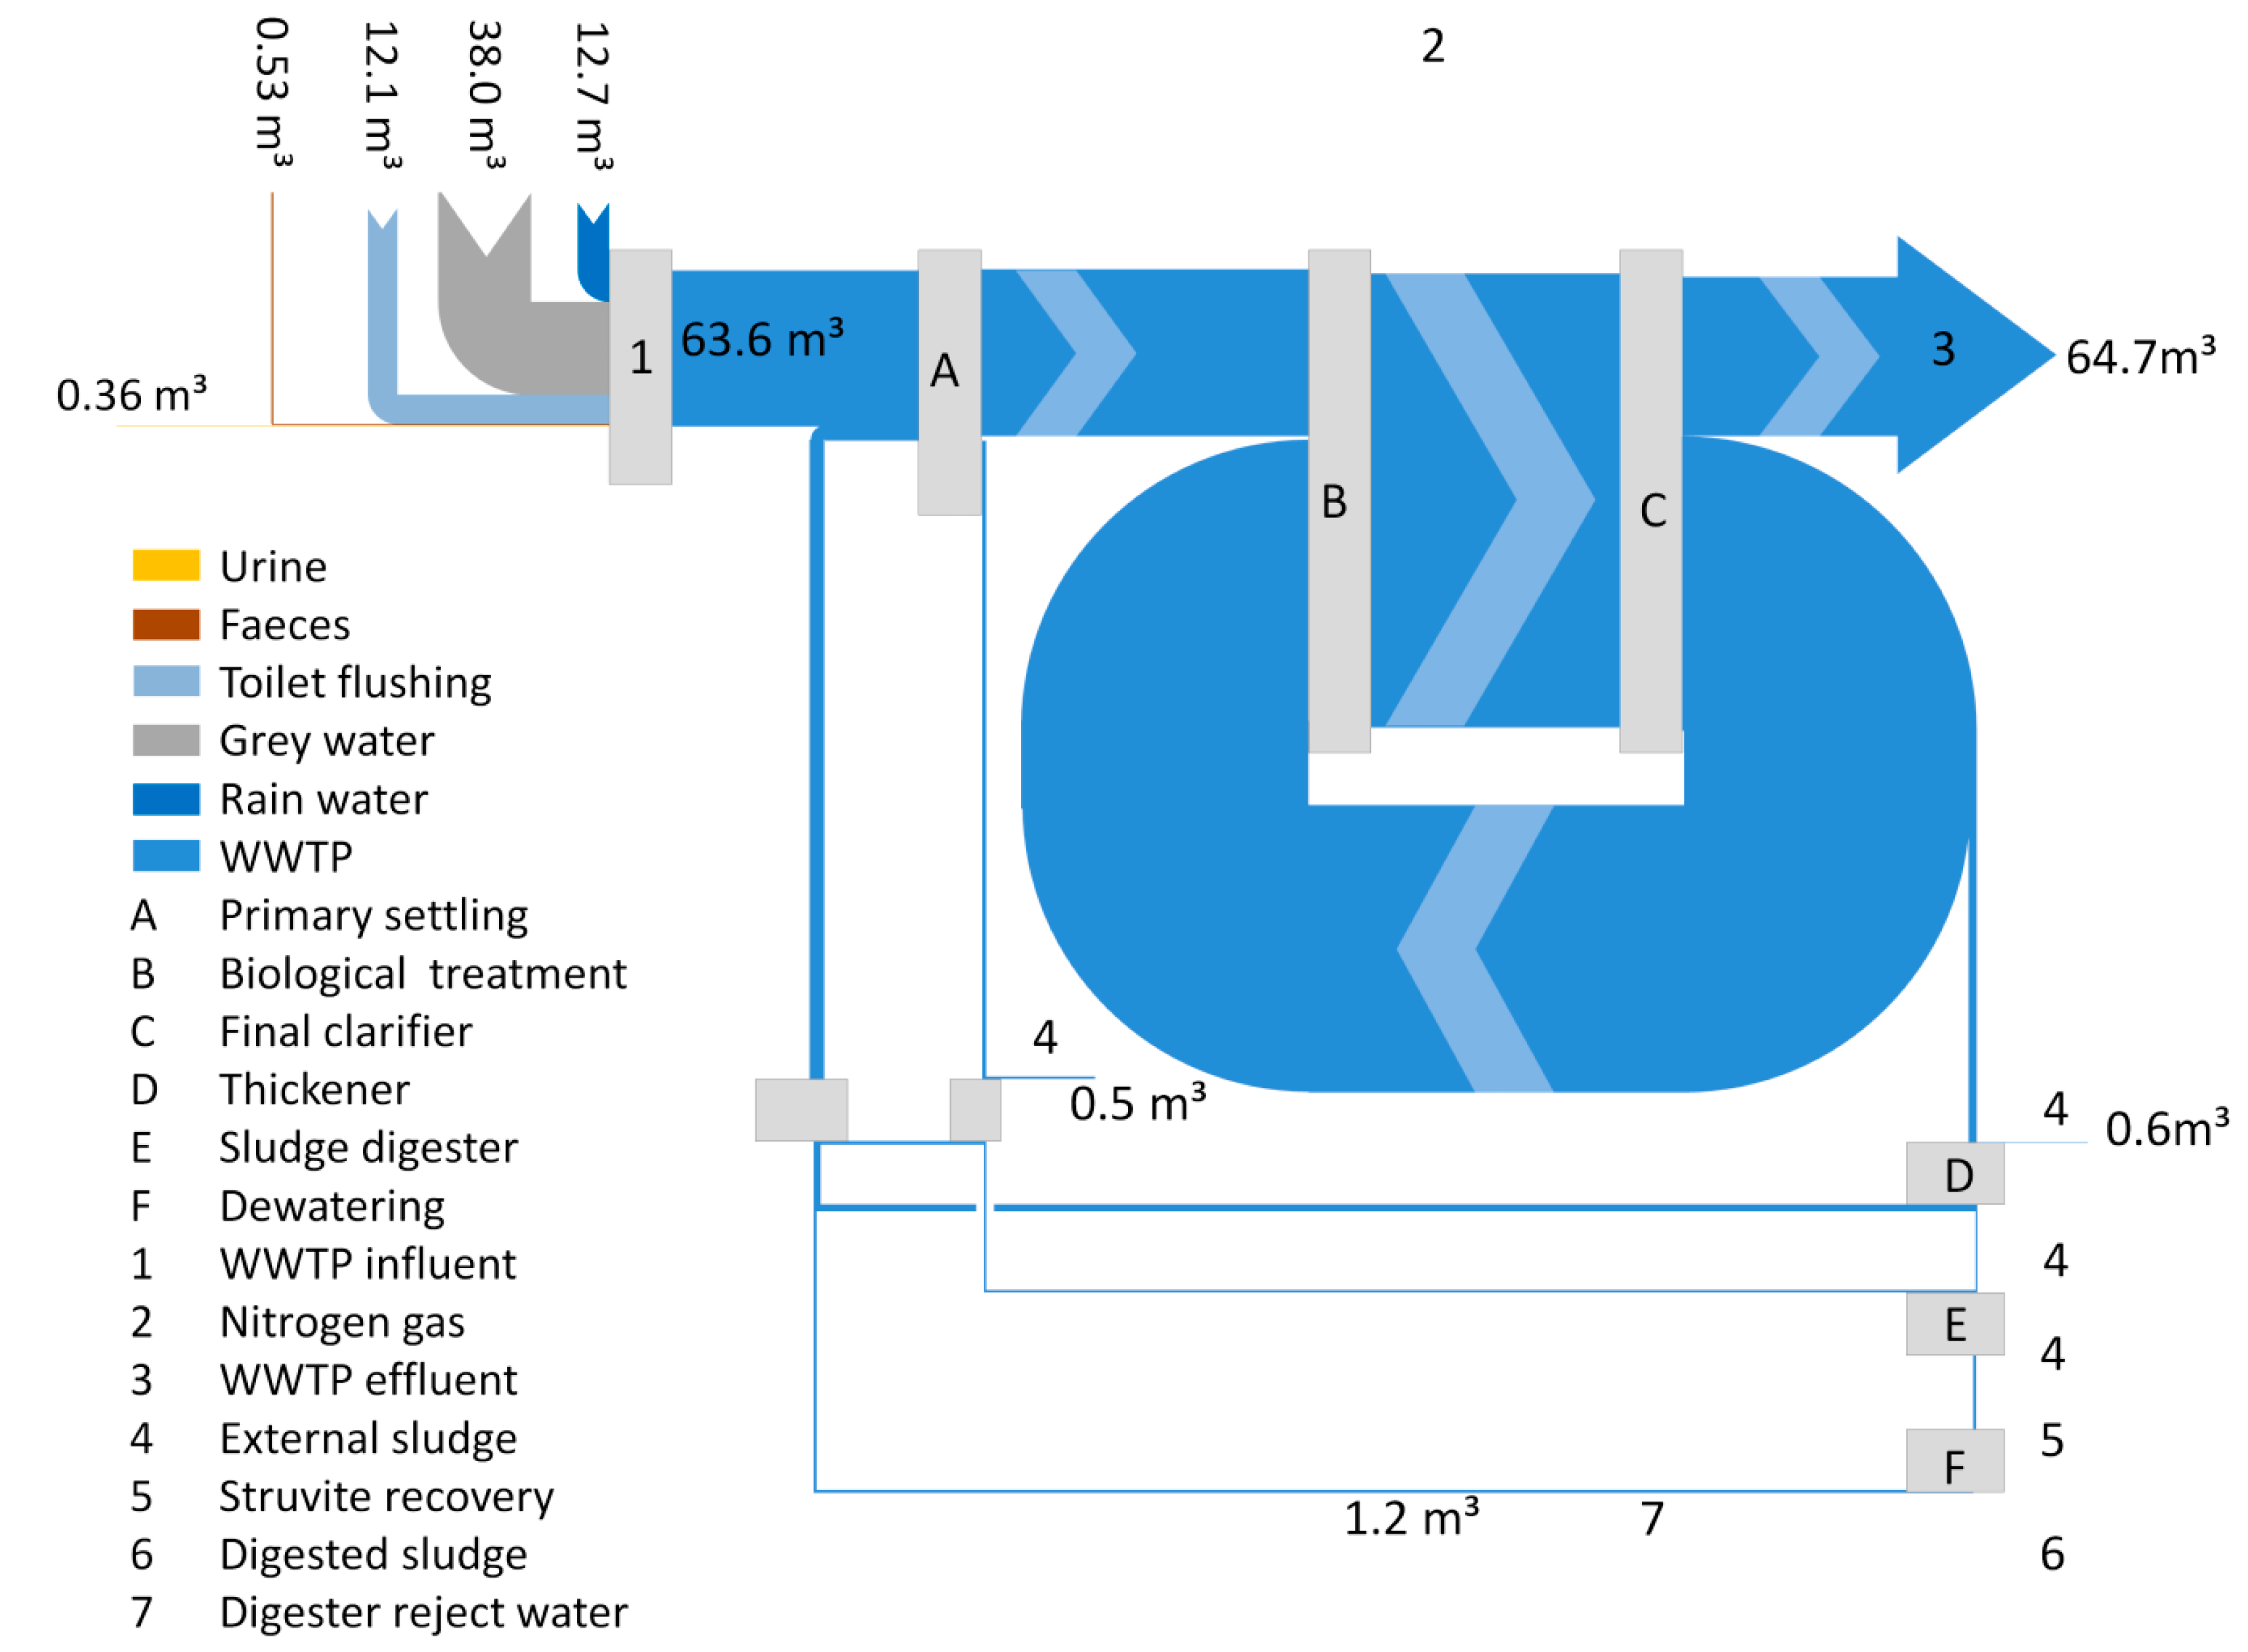
The first one visualizes the absolute flows through the process in mio m³ per year (volume streams). Data is from the Amsterdam-West waste water treatment plant (WWTP). The main loop leads water from the clarification stage back to the biological treatment stage.

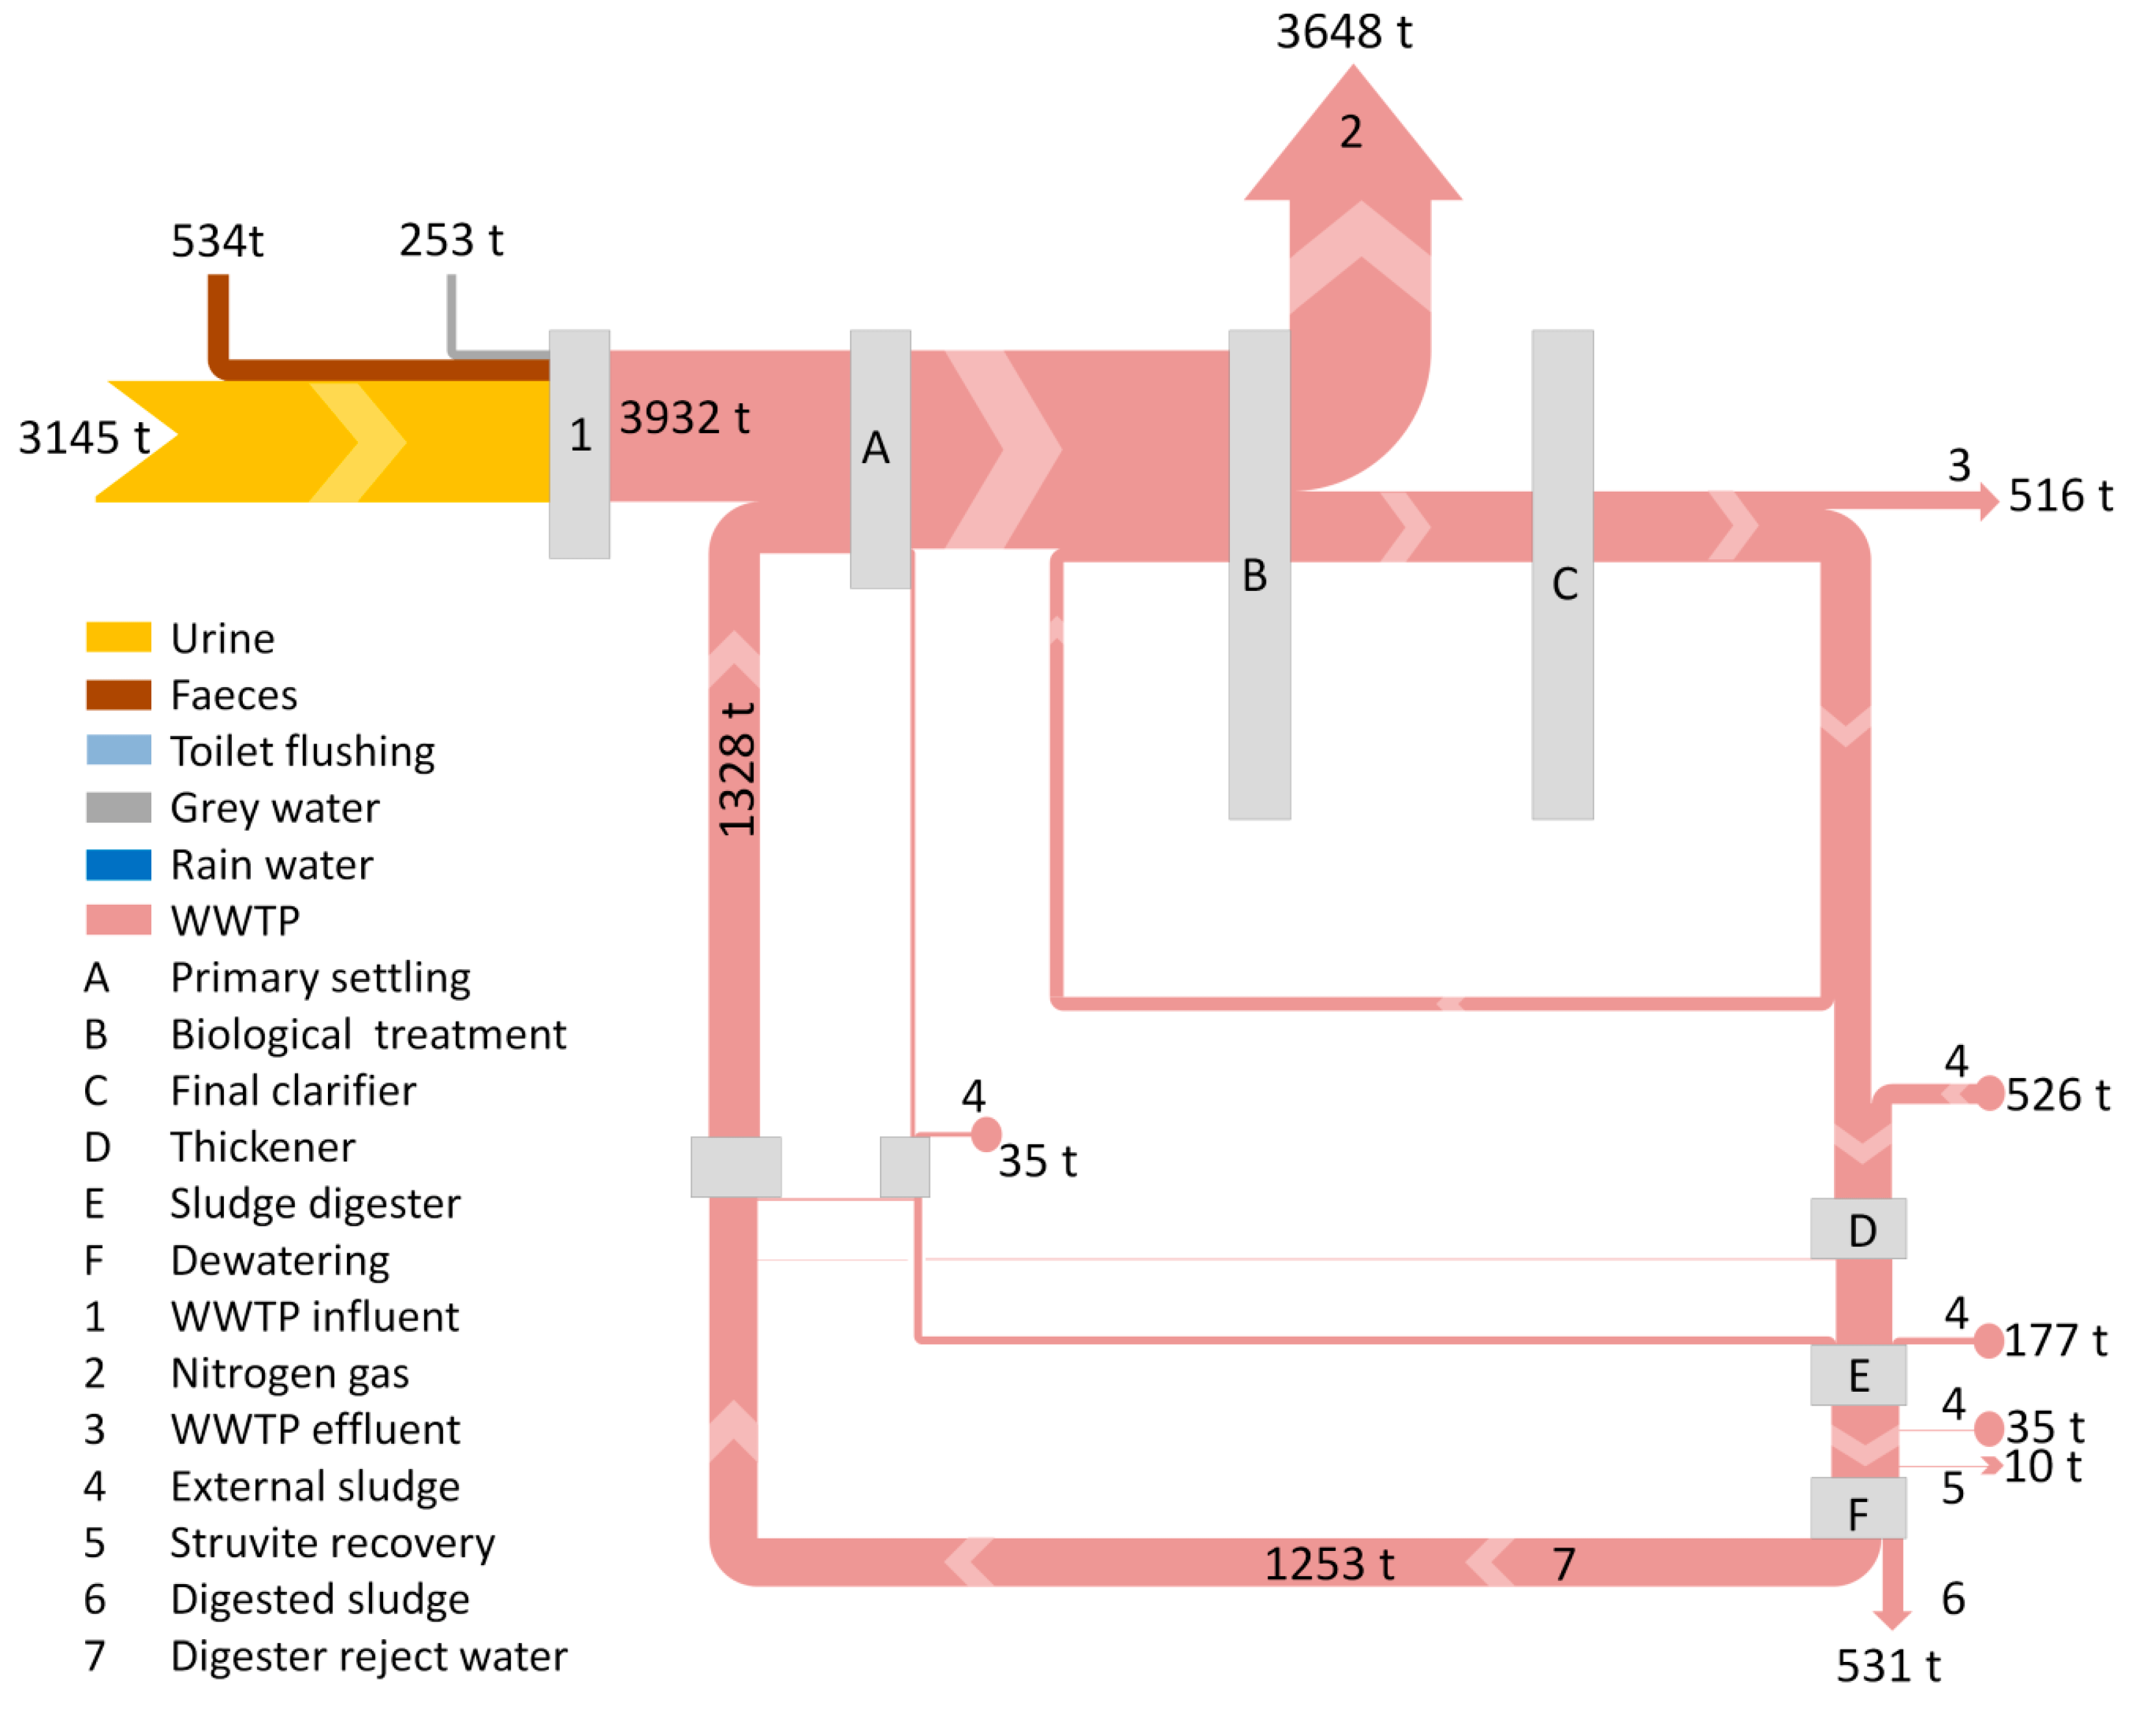
The second Sankey diagram uses exactly the same process structure, but flows are displayed in tons of nitrogen per year. Most of the nitrogen leaves the system as a gaseous effluent. In contrast to the above, the loop of nitrogen loads is in the reject water from the digester fed back to the primary settling stage.

Anyone in for calculating the concentrations? Read the full article here for details.

Metabolic, Rotterdam Construction Flows

Dutch consulting firm Metabolic have posted a great article ‘Why data visualization is critical to driving sustainable change’ on their blog. It features several examples of Sankey diagrams and argues that good visualization is key to sustainability projects and communication.

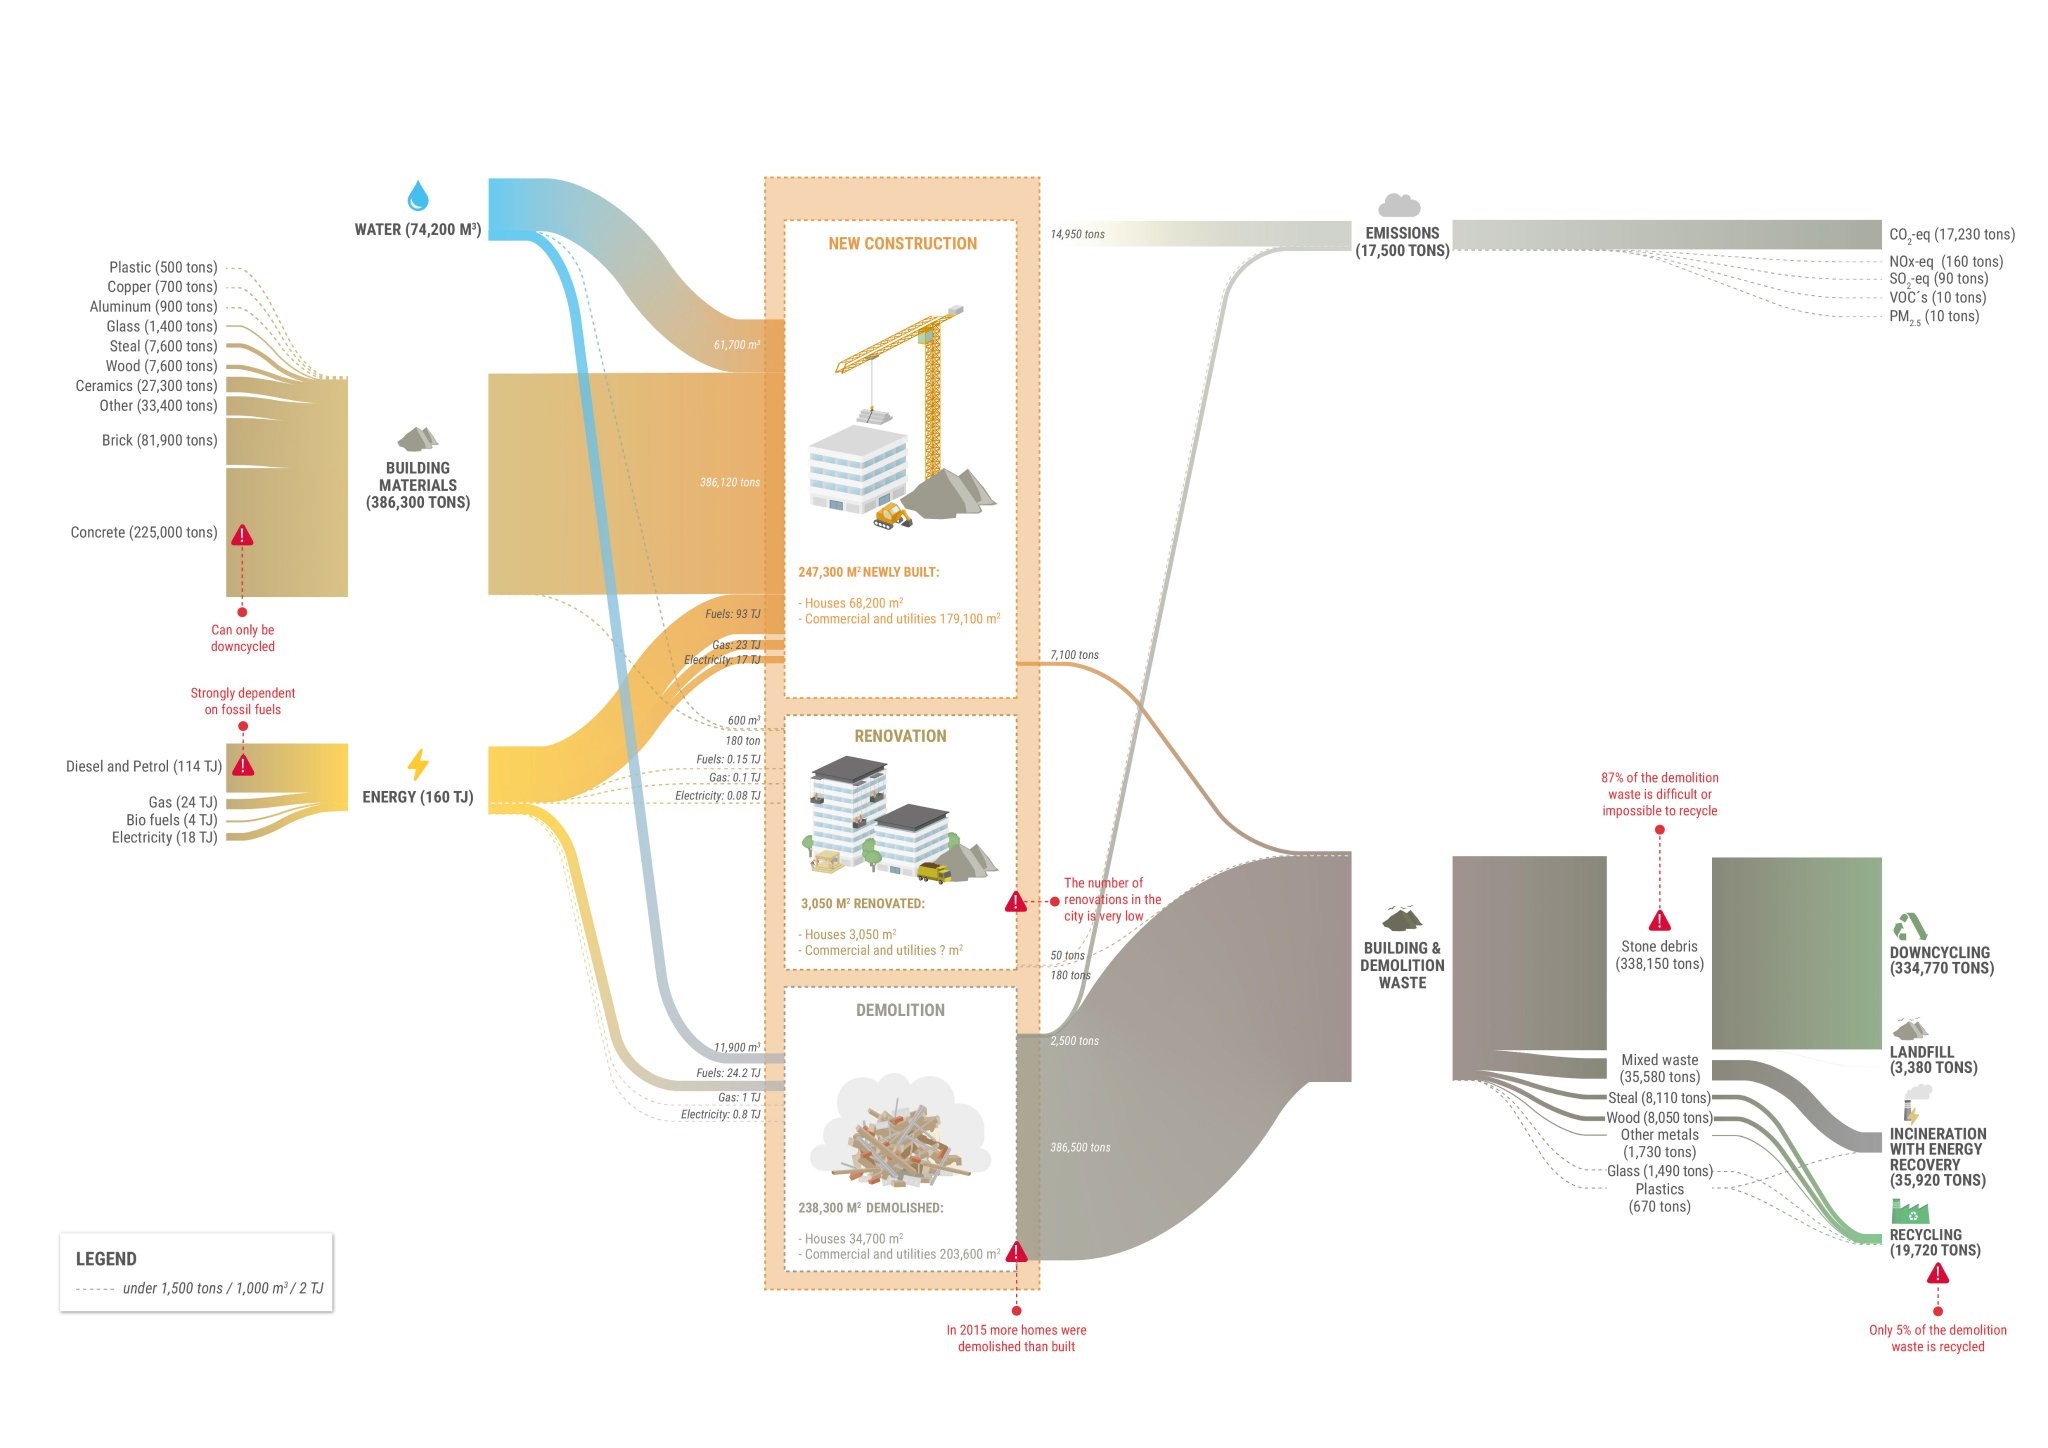
This infographic shows material flows (construction materials, demolition waste) in tons and energy in TJ. Flows relate to the construction sector in Rotterdam in the year 2015. This was originally produced by Metabolic for the report ‘Circular Rotterdam’.

The authors say. “This Sankey diagram on Rotterdam’s construction sector serves as a strong example of a data visualization for sustainability. It gives municipal authorities and industry stakeholders a clear idea of where they need to intervene – emissions generated largely in construction, material waste largely in demolition. Potential intervention points are highlighted in red; from reducing dependence on fossil fuels in construction to ensuring buildings are designed for renovation or disassembly rather than demolition.”

Energy Flows in The Netherlands 2016

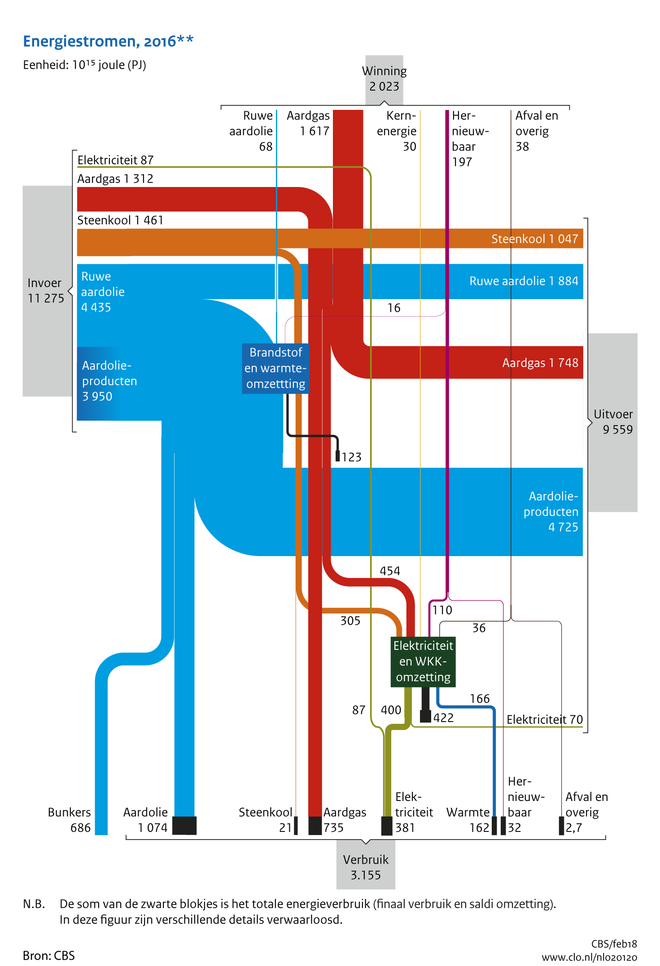
The below Sankey diagram depicting energy flows in the Netherlands in 2016 is very interesting. Actually it features two dimensions: energy production and consumption (from top to bottom) and energy imports and exports (from left to right). This is quite different from other national energy balances I have presented on this blog before (such as e.g. for Switzerland 2015, Chile 2015, Lithuania 2013, or Sweden 2014)

It can be found in the ‘Compendium voor de Leefomgeving’ (Environmental Data Compendium) a website run by the Dutch Government (Rijksoverheid) and is titled ‘Aanbod en verbruik van energiedragers in Nederland, 2016’ (Supply and consumption of energy carriers in The Netherlands, 2016).

Data for this Sankey diagram is from Centraal Bureau voor de Statistiek (CBS). Flows are in petajoule (PJ). Locally produced energy (‘Winning’) in 2015 was at 2.023 PJ, with a consumption (‘Verbruik’) of 3.155 PJ.
So, the Netherlands still had to import some 1.000 PJ to cover demand. However, it imported 11.275 PJ (‘Invoer’) and exported 9.559 PJ (‘Uitvoer’). In the first pace, the Netherlands seem to be an energy transit country. This is owed to the fact that Rotterdam is the largest oil port in Europe, and is a prime location for handling oil products (‘Aardolieproducten’).

Water Cycle in the Netherlands by G Singh

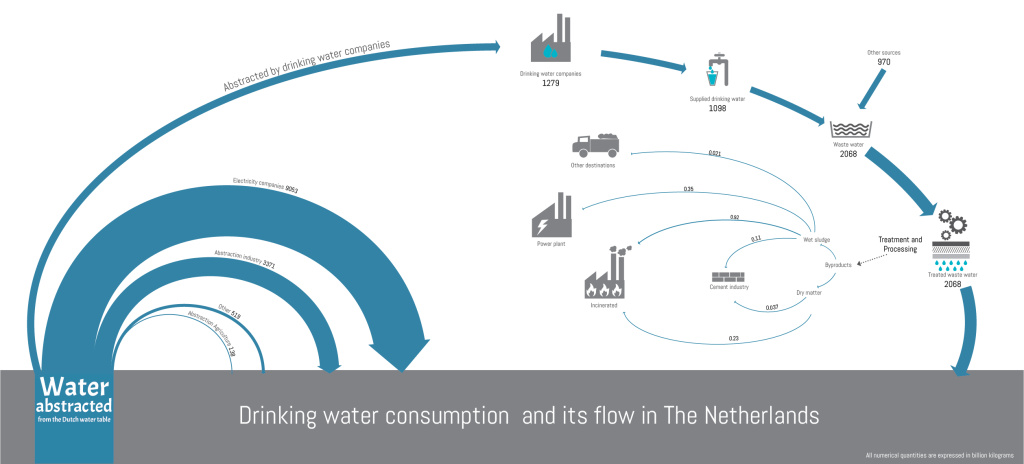
Just a quick post before the weekend: Visualization of the water cycle in the Netherlands by Gunjan Singh. See initial sketch and some comments here.


Quantities are in billion kg (=million tons). “The weight of the arrows depict the proportions most of the time”, exceptions are in the thin arrows at the right which would otherwise be fine hair lines only and almost invisible.

Amsterdam Energy System Visualized

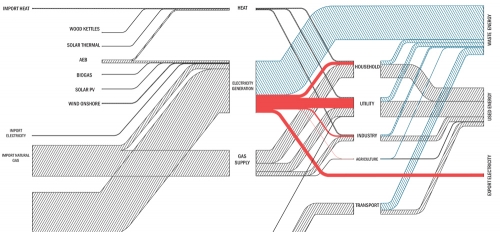
Tom Van Heeswijk and Changsoon Choi, landscape architecture master students at Wageningen University in the Netherlands have created the below “preliminary Sankey diagram of the Amsterdam energy system”. This is part of the larger project URBAN PULSE described on the research page of the NRG lab website.

Only the top part of a larger Sankey diagram is seen here, the bottom part with fossil fuels apparently cropped. No units or figures shown, so just a schematic visualization.

Nevertheless some interesting features: in contrast to many other Sankey diagrams, nodes are not depicted with outlines but shown as gaps with their name. Electricity is highlighted as red bands while all other flows have a single-hatching fill pattern.

Beauty of simplicity…

Phosphorus Flows in the Netherlands

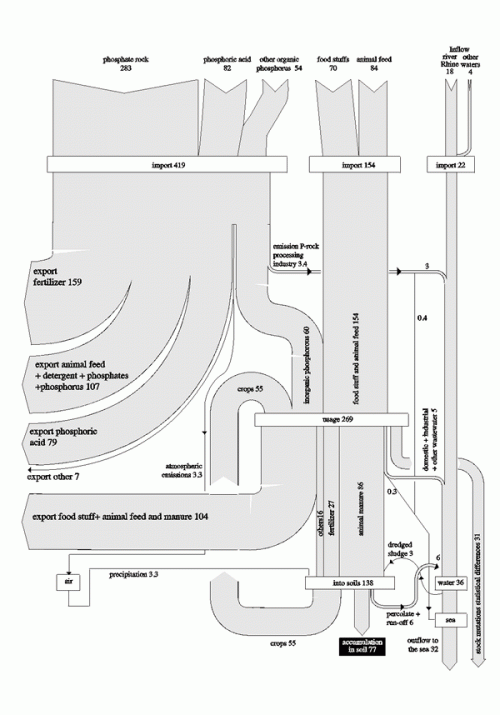
A recent visit to an organic farm and a chat with one of the staff on peak phosphorus made me search for Sankey diagrams on phophorus flows. Managed to find two, one of which is shown below. It is from an article ‘Phosphate recovery from animal manure the possibilities in the Netherlands’ by Van Ruiten Adviesbureau / Projectbureau BMA, for CEEP (November 1998) and shows phosphorus flows in the Netherlands in 1995 in million kg-P.

“It can be seen that 84 million kg P are imported in cattle feed alone (roughly 1/3 of the amount of P that is imported in phosphate ore). The excretion of phosphorus in animal manure is 86 million kg P according to the chart (about 197 million kg P2O5) … Moreover the figure shows that discharges of household and industrial waste water contain 10 million kg P. This is about 1/10 of the amount of P in animal manure.”

OK, this ia black/white retro style, but nevertheless a good Sankey diagram with flows to scale. Three vertical “columns” are for actual phosphorus imports: The largest quantity is direct imports (from phosphate rock, as phopshoric acid, and other organic phosphorous). The middle import column is for phosphorus embodied in food stuffs and animal feed. The third import pathway into the Netherlands is in waterways, such as the Rhine river, but this fraction remains unused. A large quantity of phosphorus is exported again (flows branching out to the left). 77 million kg-P per year accumulate in the soil. Another interesting detail is the flow labeled “stock mutations and statistical differences” branching out to the right.

Also see this post with a nitrogen flow Sankey diagrams from the Netherlands.

I will dig out the other phophorus Sankey and present it here in the near future…