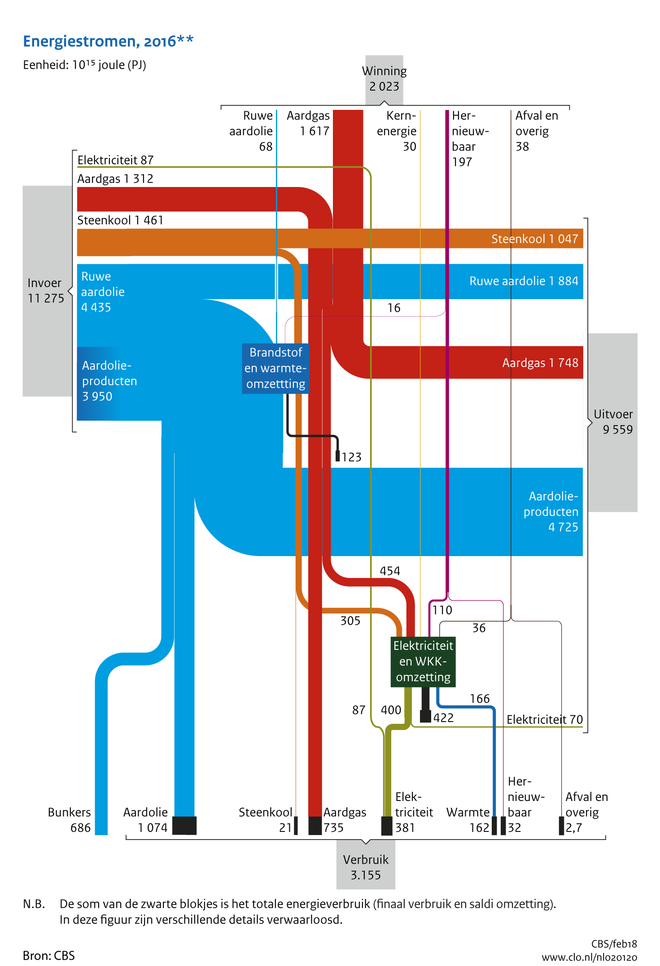
The below Sankey diagram depicting energy flows in the Netherlands in 2016 is very interesting. Actually it features two dimensions: energy production and consumption (from top to bottom) and energy imports and exports (from left to right). This is quite different from other national energy balances I have presented on this blog before (such as e.g. for Switzerland 2015, Chile 2015, Lithuania 2013, or Sweden 2014)
It can be found in the ‘Compendium voor de Leefomgeving’ (Environmental Data Compendium) a website run by the Dutch Government (Rijksoverheid) and is titled ‘Aanbod en verbruik van energiedragers in Nederland, 2016’ (Supply and consumption of energy carriers in The Netherlands, 2016).
Data for this Sankey diagram is from Centraal Bureau voor de Statistiek (CBS). Flows are in petajoule (PJ). Locally produced energy (‘Winning’) in 2015 was at 2.023 PJ, with a consumption (‘Verbruik’) of 3.155 PJ.
So, the Netherlands still had to import some 1.000 PJ to cover demand. However, it imported 11.275 PJ (‘Invoer’) and exported 9.559 PJ (‘Uitvoer’). In the first pace, the Netherlands seem to be an energy transit country. This is owed to the fact that Rotterdam is the largest oil port in Europe, and is a prime location for handling oil products (‘Aardolieproducten’).
