Tag: cost

Material Flows and Value Streams in Mining

A news item reporting on a 2019 workshop on sustainability assessment by Liesbeth Horckmans (VITO) also makes mention of findings in the European research project METGROW+. What caught my eye were two Sankey diagrams from the field of mining and metals production.


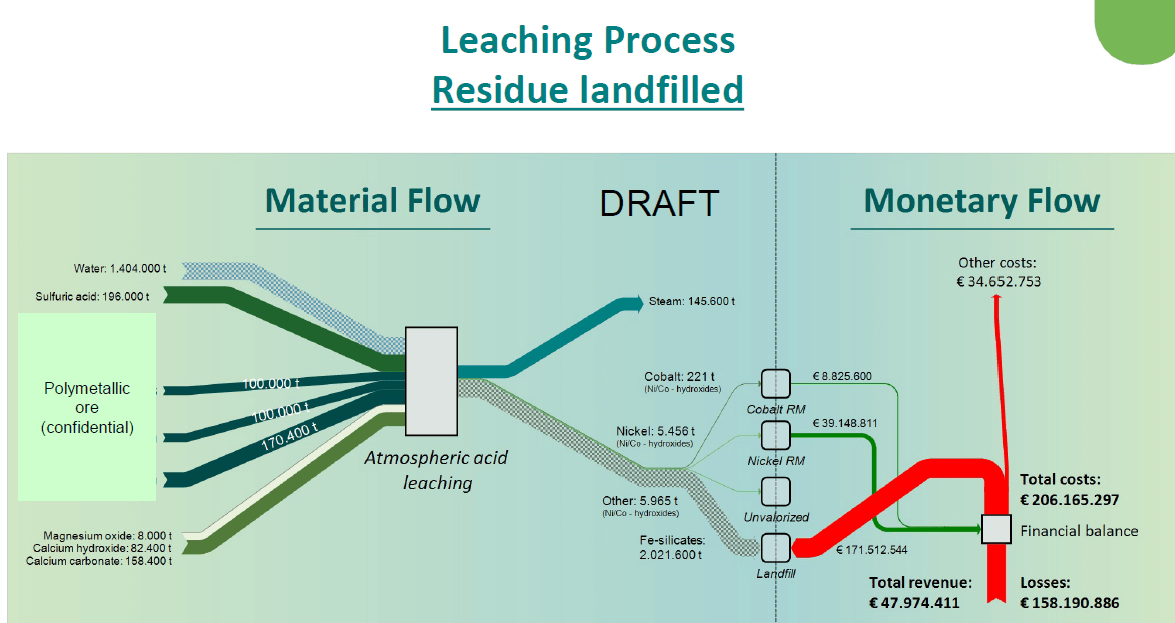
(Source METGROW+ Project via Crocodile project news page)

The Sankey diagram is interesting in two ways. First, these are actually two Sankey diagrams, touching each other at the nodes along the dotted ‘cut here’ line. The left part shows material flows in mining and metals production. From the tailings that typically end up on a landfill, nickel and cobalt are recovered. The right part visualizes the value streams linked to metal recovery and and costs associated with the landfill. These “monetary flows” are shown in red (if it is an expense) and in green (if it is a revenue). They run in opposite directions and are connected at the “Financial Balance”.

A second Sankey diagram (not shown here) compares this to a situation, where the Fe silicates typically sent to landfill can actually be “valorised” and fed back into the material cycle. In this case the financial balance can actually show a profit.

The second interesting aspect of this Sankey diagram is the way they handle flows that are out of scale (an issue I am particularly wary about, as some of you might have noticed).
In the mining and metal production process the water quantity being used is threefold the materials quantity, so the water flow would normally be three times the width of all the other flows in the Sankey diagram, if they were to scale. Here, the authors opted instead to mark the flow with a pattern and also use a pastel color to signal that this flow is not to scale.
The same on the output side, where we see the tailings stream (2 million tonnes) that is much much larger than the green recovered metals flows. If you were to draw these flows to scale, the arrow to ‘Landfill’ would be many times wider, and most likely spoil the whole diagram. Instead they opted to draw it in light grey with a moiree pattern. …
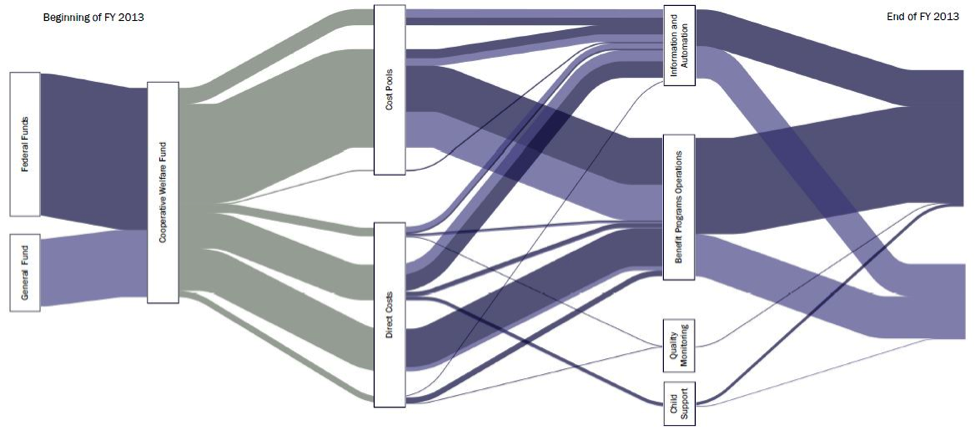
Flow of Resources in Large Organizations

A group of people from Idaho’s Office of Performance Evaluations, an independent agency of the state, have contributed a post to the AEA365 blog – A Tip-a-Day by and for Evaluators back in June 2014.

Rakesh Mohan, Lance McCleve, Tony Grange, Bryon Welch, and Margaret Campbell recommend Sankey diagrams as “A Cool Tool for Explaining the Complex Flow of Resources in Large Organizations”

“Communicating the flow of dollars was the trickiest piece of the study. We considered narratives, tables, and traditional flowcharts. Ultimately, we used Sankey diagrams that helped stakeholders visualize funds moving through the department making them the most useful features of our report.”

The Sankey diagram depicted shows Idaho state funds in FY2013. Although the absolute figures or the total sum are not shown in this figure, the diagram is most likely based on real budget data.

Where do Sankey diagrams work? Data Revelations

Interesting blog post by Steve Wexler of Data Revelations. Long article, long title: “Circles, Labels, Colors, Legends, and Sankey Diagrams – Ask These Three Questions”.

The really interesting part for the Sankey diagram aficionados is Steve’s advice on when to use Sankey diagrams, and when you should avoid using them.

Steve illustrates his point with the below example by ‘Music Major – Data Miner’ Jeffrey A. Shaffer (original post is here)

A combination of a stacked bar chart with a distribution diagram, nicely decorated with a trumpet … “Within this context, this very creative chart works”, Steve writes.

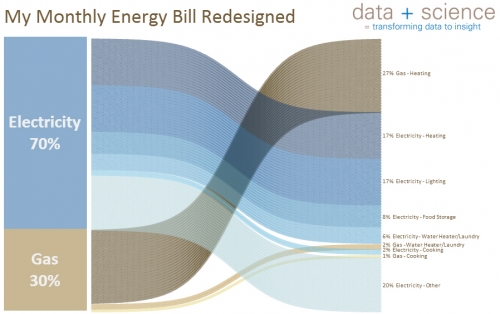
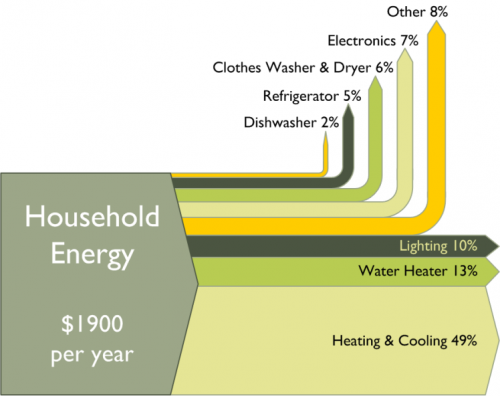
He then goes on and shows another one by Shaffer, also a distribution diagram: the original pie chart data from an energy bill has been redesigned and was presented as a distribution diagram (two stacked bars with bands to link them)

In this case, Steve concludes, the choice of a Sankey diagram is maybe not that wise, since the actual important information (44% of energy cost is for heating) doesn’t really come across quickly and clearly. A bar chart might work better here. Sankey diagrams can create a “cool!” or a “crap!” response, depending on the context. See the original Shaffer post here.

Adding my 2c from a technical perspective I would say that both diagrams have a shortcoming: The bands don’t maintain their width as they cross over the others diagonally. Somewhat acceptable in the trumpet diagram as the right bar on the right side listing the music composers is higher than the one at trumpet bell (sound spreading out). Not acceptable in the second diagram where the two stacked bars have the same height. This is obviously an error in the curve radius calculation (read ‘The Math Behind those Curves’)

Sankey diagrams @ visualign

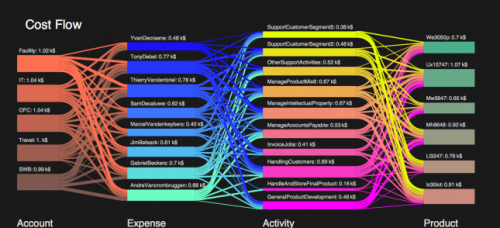
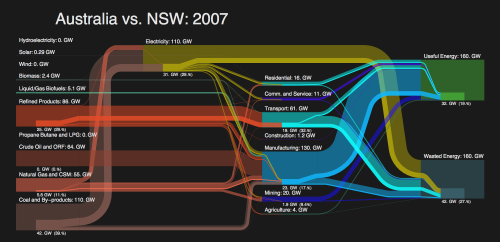
The blog post I mentioned yesterday also has two fine examples of Sankey diagrams done with Mathematica. Nice colorful ones. Black background.

The first one is on cost flows and their distribution onto accounts, expenses, activities, and products (each represented by a column with nodes).

The other is by Sam Calisch (the author of the Mathematica workbook) and visualizes the efficiency of energy use in Australia.

Actually this second diagram is made up of two Sankey diagrams: the main one for Australia, the overlay one with the values for New South Wales. A cool idea to show the share of NSW.

The author of the post at visualign says that he “wouldn’t be surprised to see Sankey Diagrams make their way into modern data visualization tools such as Tableau or QlikView, perhaps even into Excel some day…”. This is of course an idea I like…

Infographics Experts on Sankey Diagrams (Part 1)

Chiqui Esteban who runs the Spanish blog infografistas.com had two posts back in March/April about a discussion he had with his colleague Xocas on how to name Sankey diagrams. Or, to be more precise: how a certain type of diagram that is more and more used in infographics should be named correctly.

They are absolutely funny, so I am trying to give you a translation of these two blog posts. This is part 1 for a post from March 17 titled “Gráficos de erogación”. I left some words in Spanish and my comments in square brackets.

— translation start —

Distribution Graphics

A couple of months ago, Xocas and I discussed via GTalk what the name, or what should be the name of the diagrams with the little arms [‘gráficos de bracitos’]. As it turned out, the winner name was volume flow graphics [‘gráfico de caudales’].

Today, we decided to withdraw our proposal and we are going to call them ‘distribution graphics’ instead [‘gráficos de erogación’].

This is because of the coffee. The coffee machine of my new employer www.lainformacion.com (click the link, we are already up running), shows the message ‘distributing’ [‘erogando’] while you wait for your cup to be filled. Looking in the RAE [note: Real Academia Española], the verb ‘erogar’ is defined as:

(Del lat. erogāre).

1. tr. Distribuir, repartir bienes o caudales. [distribute, share the goods or funds]
2. tr. Méx. y Ven. Gastar el dinero. [México and Venezuela: spend money]

This definition is spot on. So we shouldn’t continue to call them ‘little arms’ [‘de bracitos’], ‘tubing’ [‘de tubería’], ‘squid’ [‘de pulpo’], ‘tree-roots’ [‘raíces’] or whatever diagrams any more. But don’t say that we didn’t work hard in finding the correct nomenclature. As we have to do. So Tufte will… [‘A Tuftear’].

— translation end —

The accompanying Sankey diagram apparently is from the New York Times and shows how 21.4 billion $ in federal aid for NYC after 9/11 were distributed (hey! there you are, a ‘distribution diagram’ 😉 ). Funny enough, the caption says: “The figure above is an attempt to bring sources of funds together and show how they add up (sic!) to $ 21.3 billion”.

So what is distribution for one, is “adding up” from another perspective.

Part 2, the translation of “Caudales, erogación… ¿flujo?” and a summary of the comments to follow.

Note (Aug 19): A case of DYRF, do your research first! I just detected that Chiqui himself has an English version of his article here. So, now you got the choice between two versions!

Where is the money, honey?

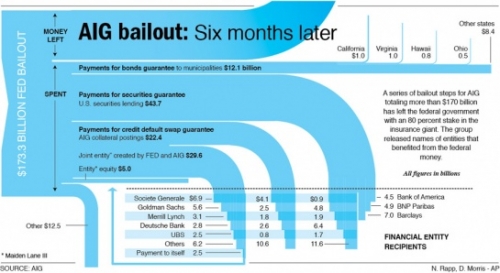
Nathan at FlowingData – Strength in Numbers presented a Sankey diagram by AP’s Nicolas Rapp and Damiko Morris (originally from this post on Nicolas’ blog). It shows where the $173 billion AIG received from government went to.

I especially like the inverse waterfall arrow endings and how they intersect with the grid of beneficiaries.

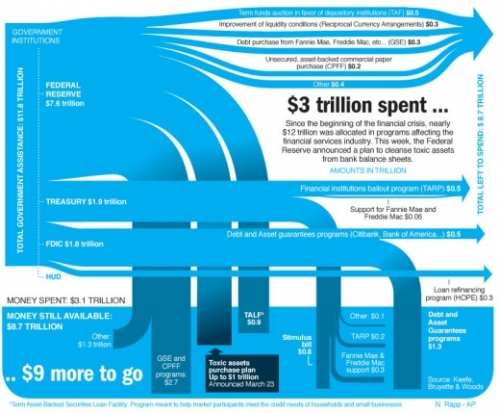
Nicolas, who works in Information Graphics for Associated Press, later presented another Sankey diagramm, displaying how the “nearly $12 trillion that was allocated in programs affecting the financial services industry” were used.

The author says “I spent the day researching and realizing this graphic” (@Nick: how much time was the research, how much the drawing?)

He adds “Fun stuff”, a comment which probably refers to the Sankey graphics part rather than to the content depicted… 🙁