Tag: Spain

Basque Country Circular Economy 2030

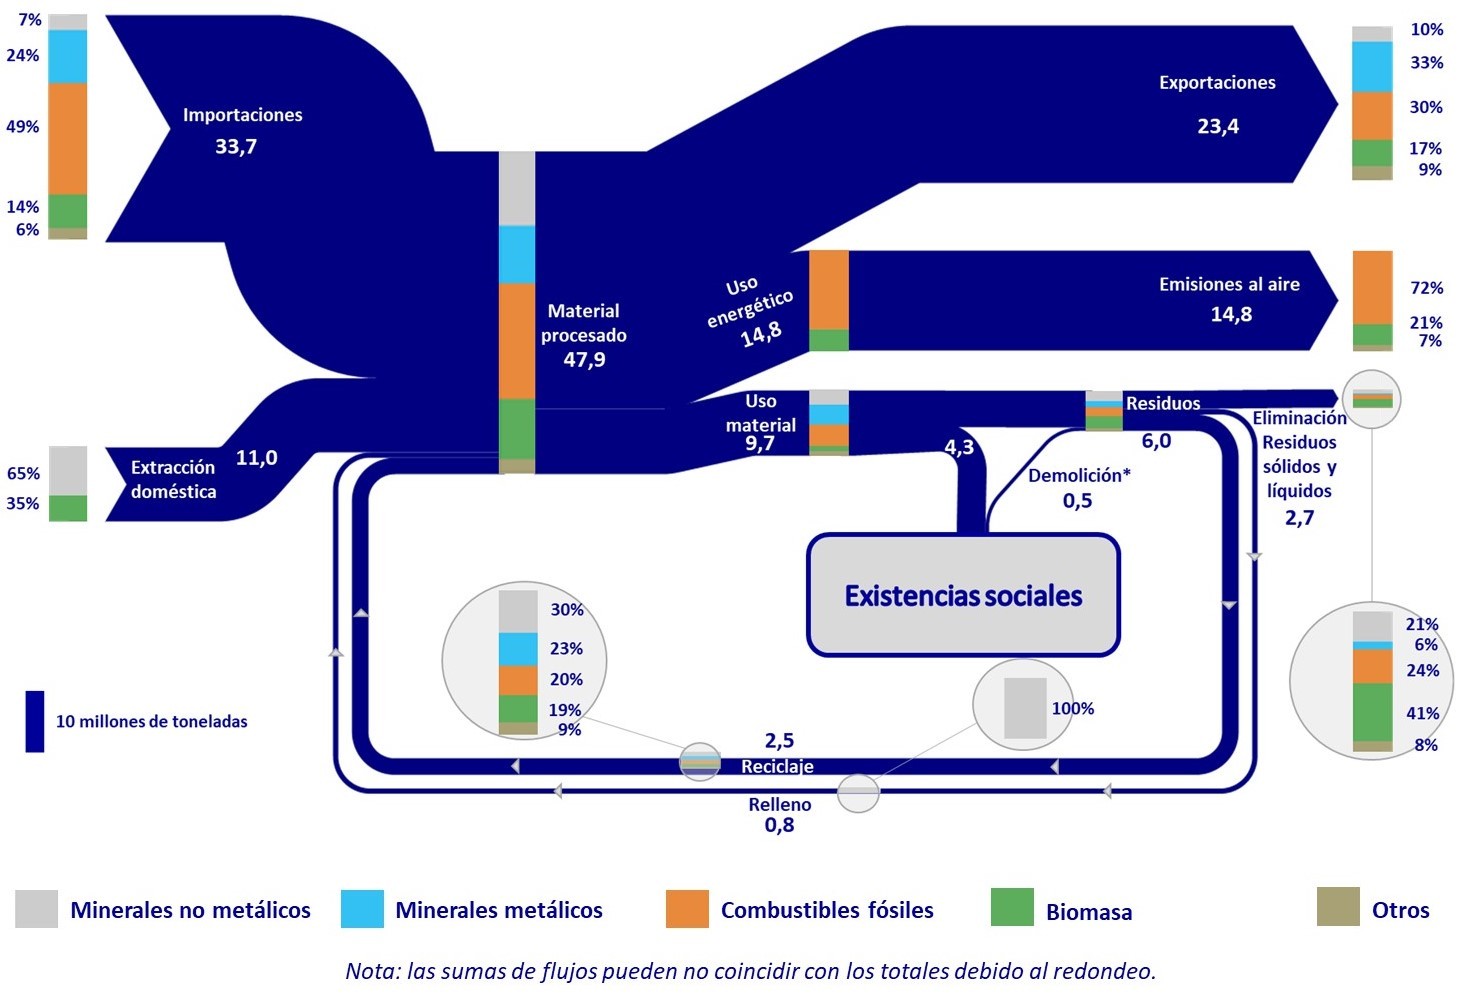
A post on the ‘Low Carbon Future’ blog by IDOM caught my attention as it featured the below Sankey diagram. The post is a summary of an event held back in 2019 on the elaboration of a Circular Economy Strategy for the Basque Country” (“Foro de participación para la elaboración de la Estrategia de Economía Circular del País Vasco 2030”).

The diagram shows mass flows in mega tonnes (Mt) for the year 2016 within the autonomous community in the North of Spain. While the arrows are unicolored, stacked bars on the streams reveal their composition with contributions from metallic minerals, non-metallic minerals, fossil fuels, biomass and others.

Somehow I couldn’t get rid of the feeling that I had seen something similar before. And indeed a similar Sankey diagram for global flows is featured in this post from 2015 and – even more so – one for EU material flows in this followup post from 2018. They seem to have served as a template for the creation of a regional Basque version.
Household Waste Recyling in Spain

An interesting blog post titled ‘Cuando las cuentas no cuentan’ (which I would figuratively translate as ‘When the numbers don’t match’) by Sergio Sastre over at the ‘Residuos Profesional’ blog.

Looking in detail at the official municipal solid waste recycling numbers for all 17 autonomous communities in Spain, published by the Environment Ministry (Ministerio para la Transición Ecológica – MITECO) for 2016, Sergio and his team found that there are discrepancies in the data, and that data quality needs improvement.

The overall recycling rate for municipal solid waste (MSW) in Spain is 33.6% … still far from the 2020 goal to reach a 50% recycling rate.

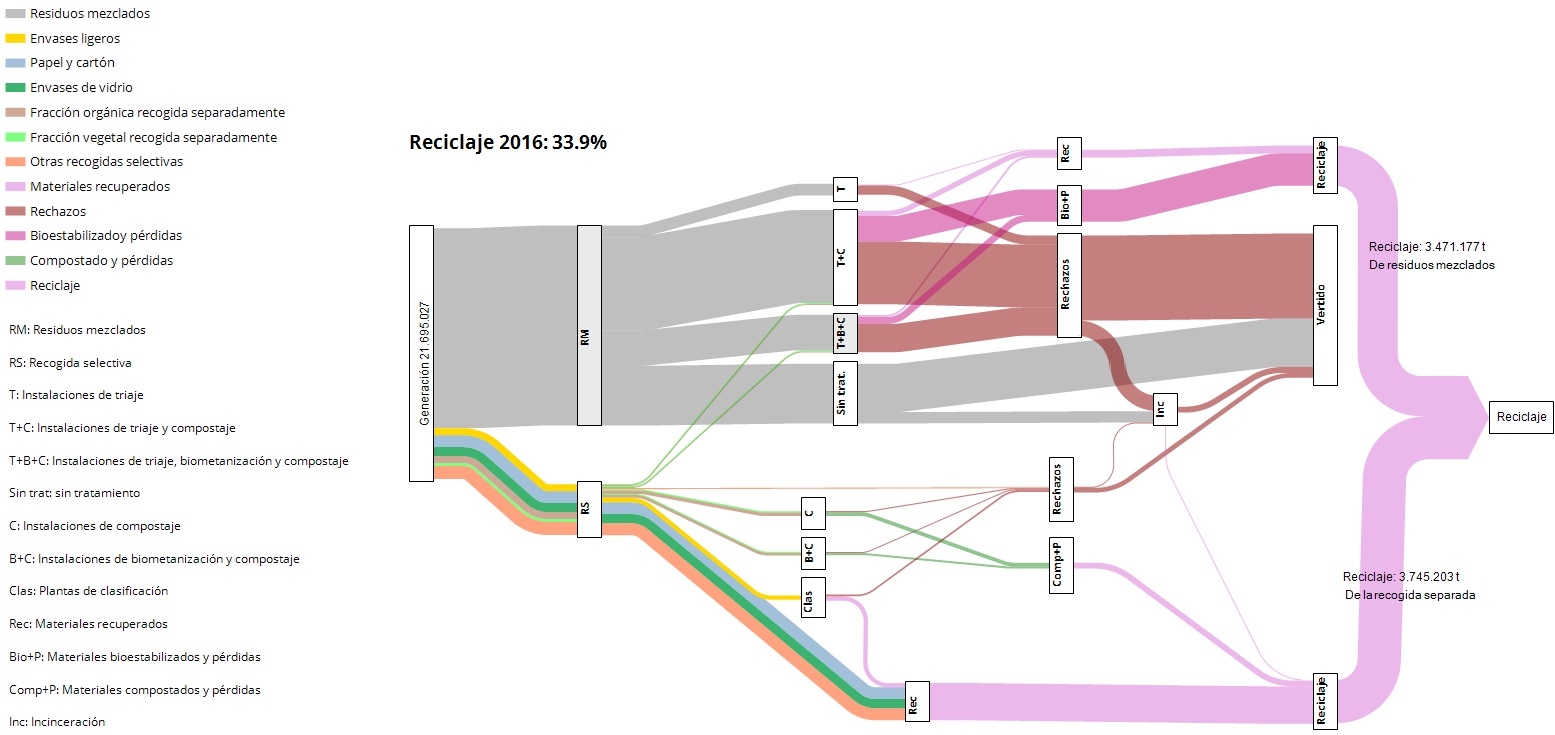
This Sankey diagram shows the breakdown of waste streams.

Flows are in tonnes per year. Of the overall 21.7 million tonnes of MSW generated in Spain, only some 7.2 million tonnes were recycled in 2016 (pink streams). A large chunk if household waste is mixed (grey stream, residuos mezclados, RM), while only a quarter is collected separately (colored streams in the lower part of the figure, recogida selectiva, RS).

Some material can be recovered from the mixed waste stream at sorting facilities and in composting plants or biogas digestors.

Gudalquivir River Basin Water Flows

I discovered this Sankey diagram in an article by Gutiérrez-Martín, C.; Borrego-Marín, M.M.; Berbel, J. on ‘The Economic Analysis of Water Use in the Water Framework Directive Based on the System of Environmental-Economic Accounting for Water: A Case Study of the Guadalquivir River Basin” (published in Water 2017, 9, 180, open access article licensed under Creative Commons (CC BY 4.0). The Guadalquivir river basin is in Andalusia, Southern Spain.

The authors note that Sankey diagrams for water flows in a river basin or catchment area are useful because they show “at a glance, several aspects of the water cycle such as economic units, abstraction, supply, use, consumption, and returns to environment (soil water not included). In studying water use pathways, Sankey diagrams illustrate quantitative information about flows, their relationships, and their transformations.”

We see water taken (“abstracted”) from surface or groundwater by water supply companies and other users, distribution and water consumption by sectors, water flows ‘lost’ to the atmosphere and return of water to the environment.

Flows in this diagram are in hm³ (cubic hectometres). Note that they decided to use another scale for water used for energy generation (x 10 hm³) since otherwise the yellow-beige would be 10 times wider and maybe spoil the whole diagram.

The diagram has a top-down orientation and numerous loops and flow feedbacks, in contrast to the typical distribution diagrams (aka alluvial diagrams). It is well structured, nicely crafted and pleasing to the eye. Definitely on my top 10 list for 2018.

Sustainability of Olive Growing in Andalusia

The Niche Canada blog ran an interesting piece by Juan Infante-Amate from Unversity Pablo de Olavide in Spain titled ‘The largest tree crop concentration in Europe: The making of olive landscapes in Southern Spain’. It is a summary of research done on the changes in olive cultivation in Andalusia from traditional olive growing in the 18th century to today’s industrialized production.

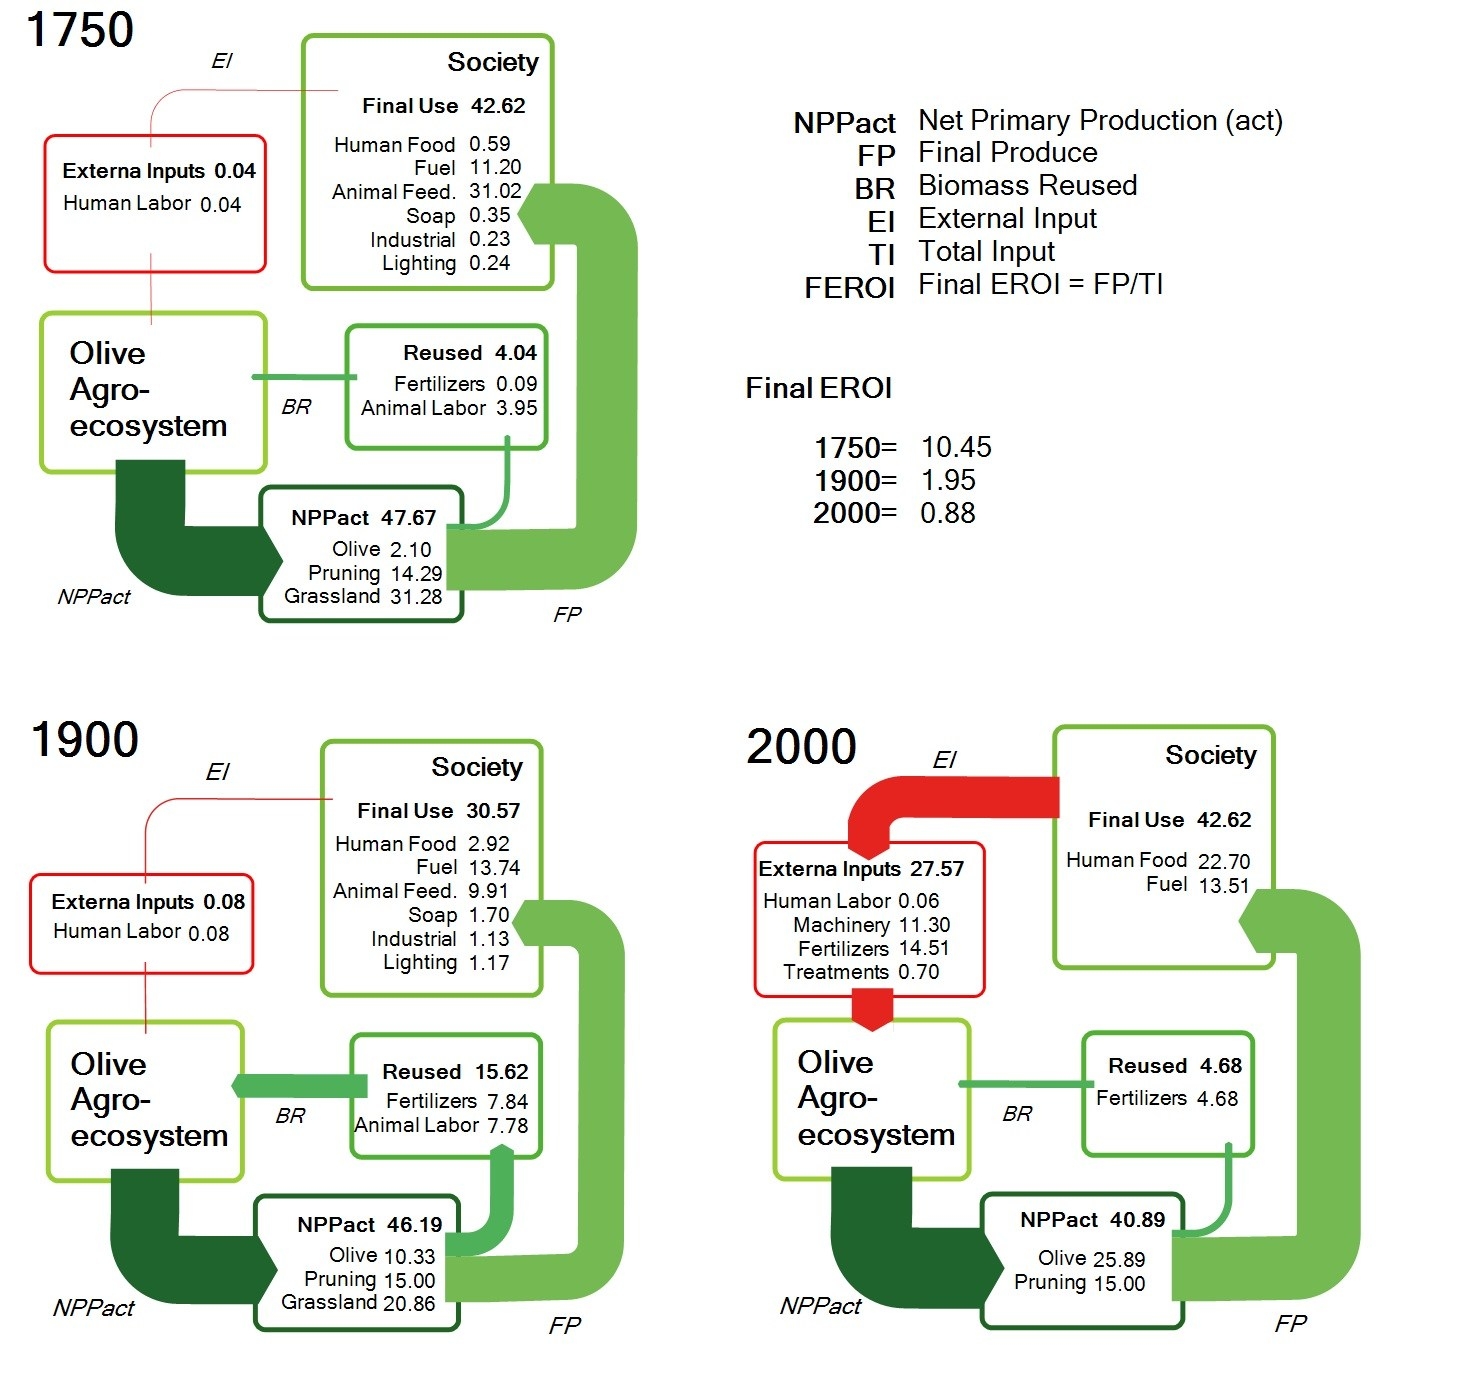
The post features these three schematic Sankey diagrams. Data is for one specific site:


(licensed under a Creative Commons Attribution-NonCommercial 4.0 International License)

The above are three snapshots of the energy flows of one production site in Andalusia in 1750, around 1900 and today. By relating the final product quantity (FP) to the total input of energy or work (TI) the researchers are trying to measure sustainability with the indicator FEROI. An indeed, “[e]verything suggests that over the course of the history of Mediterranean landscapes these current conditions have been the least sustainable.”

Interesting approach and use of Sankey diagrams to compare a sustainability indicator. References to the full research papers can be found at the end of Infante-Amate’s Niche Canada post.

Desalination by RO Process Retrofit, Sankey

Removal of salt from seawater (desalination) is used to produce drinking water and water for irrigation in the Canary Islands, Spain. This is an energy intensive process.

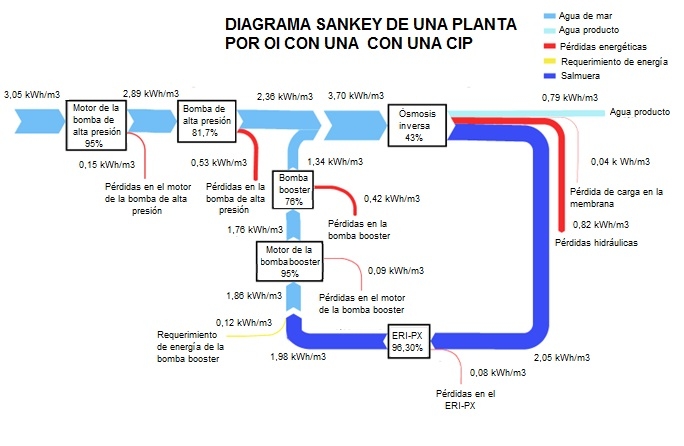
The article ‘La importancia de los sistemas de recuperación de energía en la desalación de aguas en Canarias’ (The importance of energy recovery systems in water desalination in Canary Islands) by Baltasar Peñate Suarez and Sigrid Arenas (both of Departamento de Agua del Instituto Tecnológico de Canarias, ITC) on the IAGUA blog (in Spanish) describes how existing reverse osmosis (RO) salt removal systems with Francis turbines were retrofitted to be more energy efficient.

The two Sankey diagrams in the blog post visualize the energy flows before and after the retrofit. Energy consumption per cubic metre of water desalinated could be reduced from 3.65 kWh/m³ to 3.05 kWh/m³ by installing isobaric energy recovery devices and last generation membranes.

Check out the blog post to see both Sankey diagrams.

Energy Sankey Diagram Menorca

The Spanish island of Minorca (Spanish: Menorca) is part of the Balearic islands archipelago in the Mediterranean Sea. Less crowded than Mallorca, and more tranquil than party location Ibiza, this island is popular for family holidays.

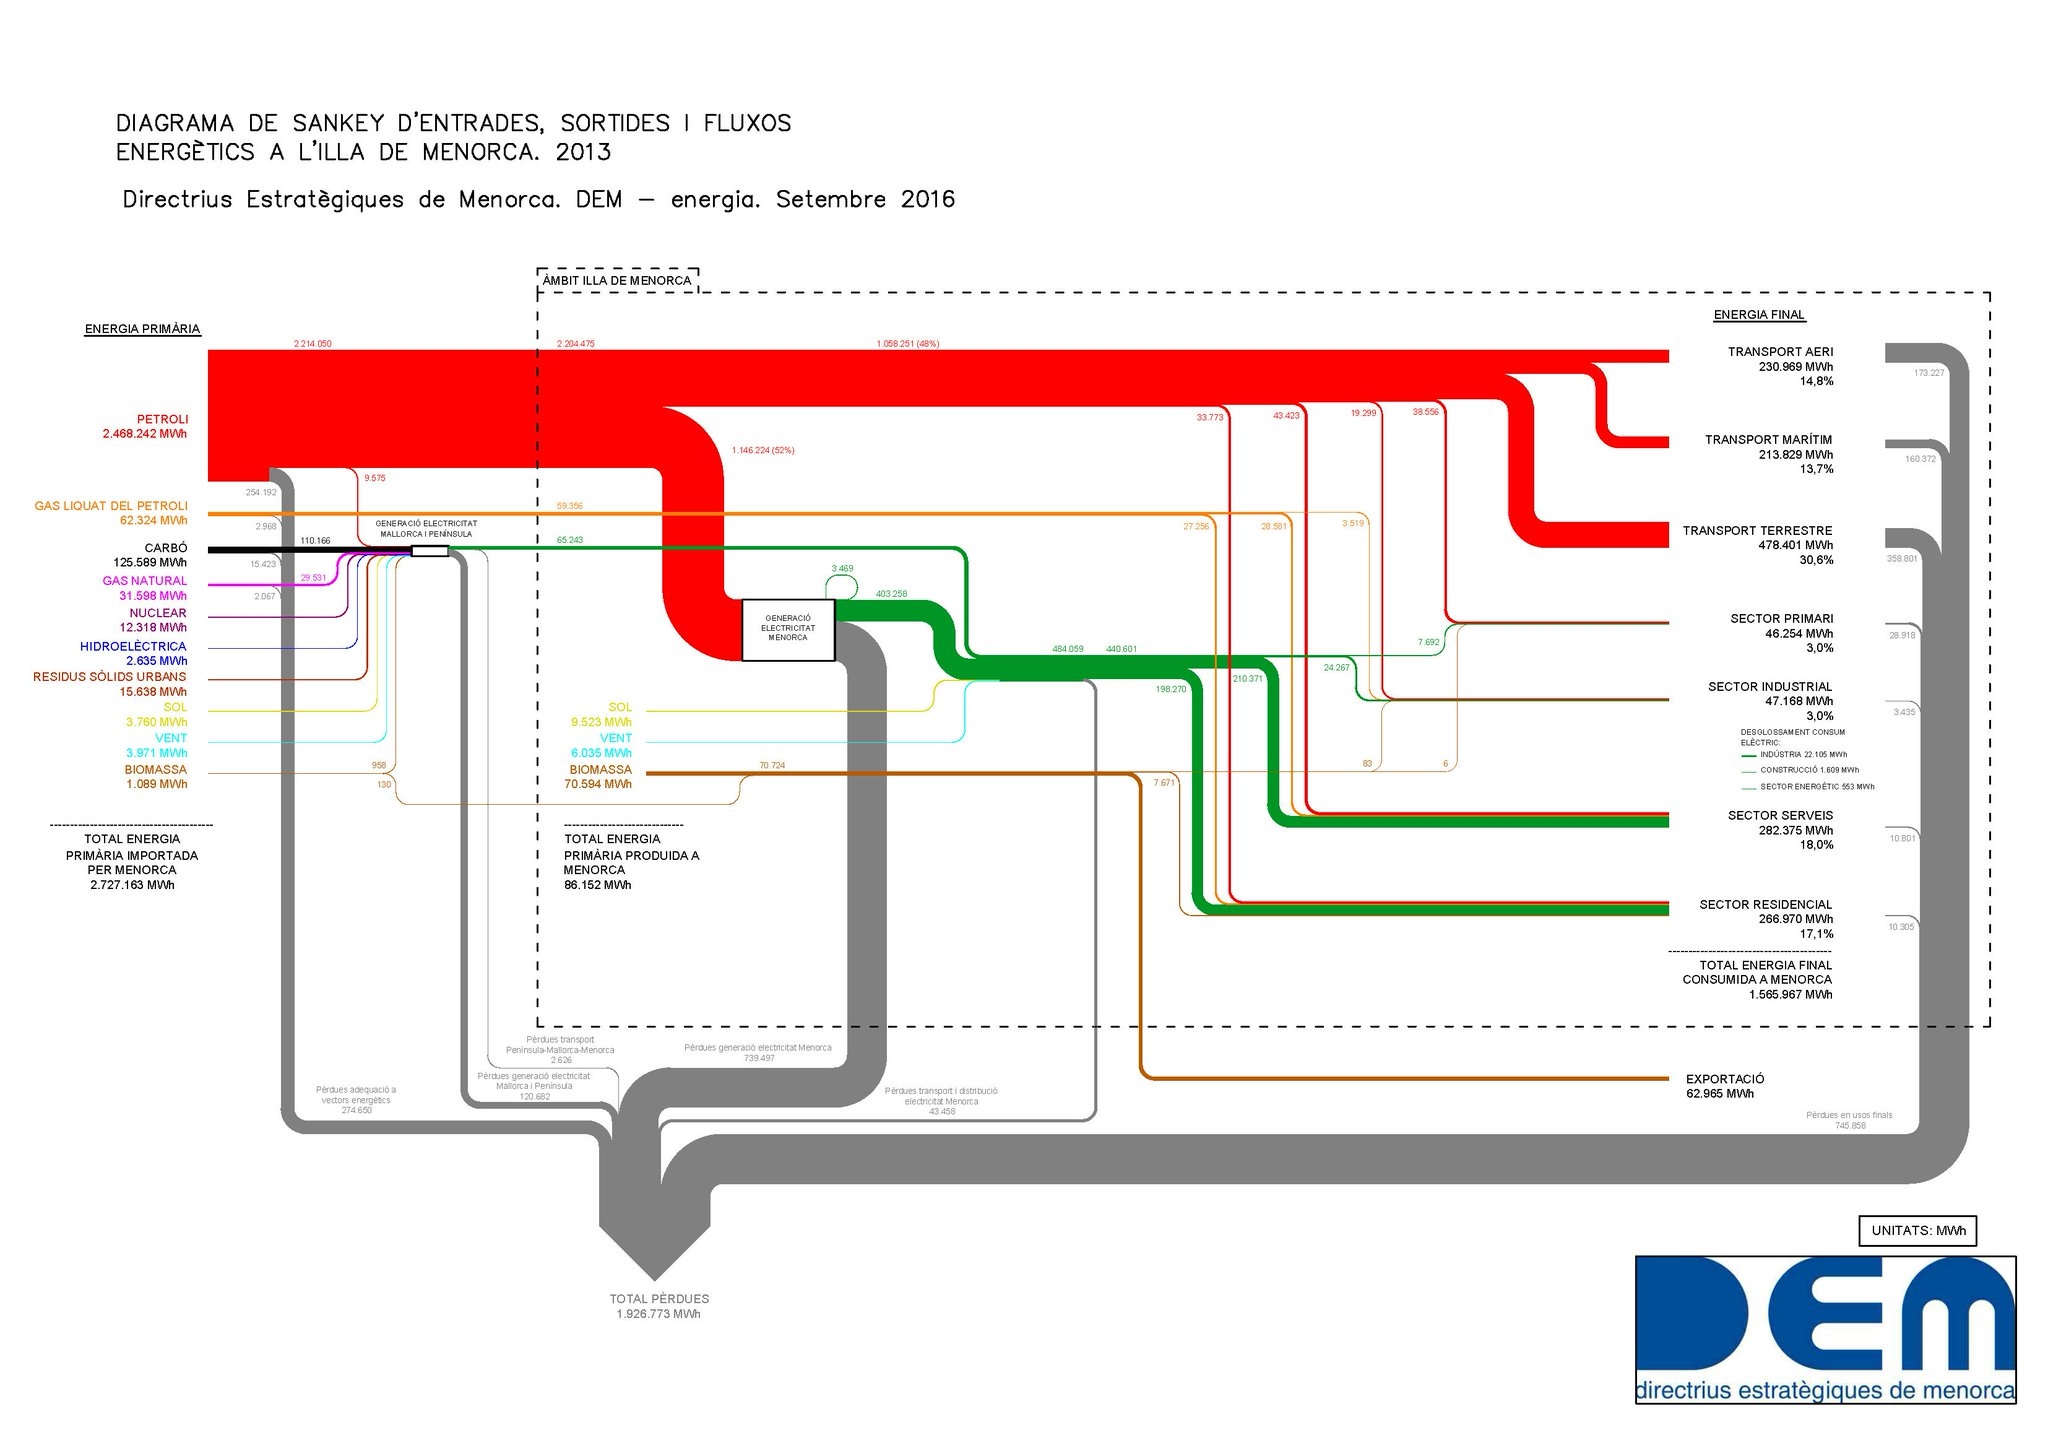
The Strategic Directorate of Menorca (Directrius Estratègiques de Menorca, DEM) has recently published this Sankey diagram depicting the energy flows of the island in 2013.


(via DEM Twitter)

Flows are in MWh. Primary energy input was 2.72 mio MWh in 2013, of which 1.56 mio MWh were used, while 1.92 mio MWh were losses. (difference was exported). Labels are in Catalan.

The energy visual is different from others that I have shown on this blog before: The island is almost entirely depending on petroleum as energy source. Maritime and air transport consumes a large part, as does the services sector (hotels). Industry sector is a rather small consumer.

You can find a report in Spanish with a similar Sankey diagram here.

Spain’s Segura River Water System

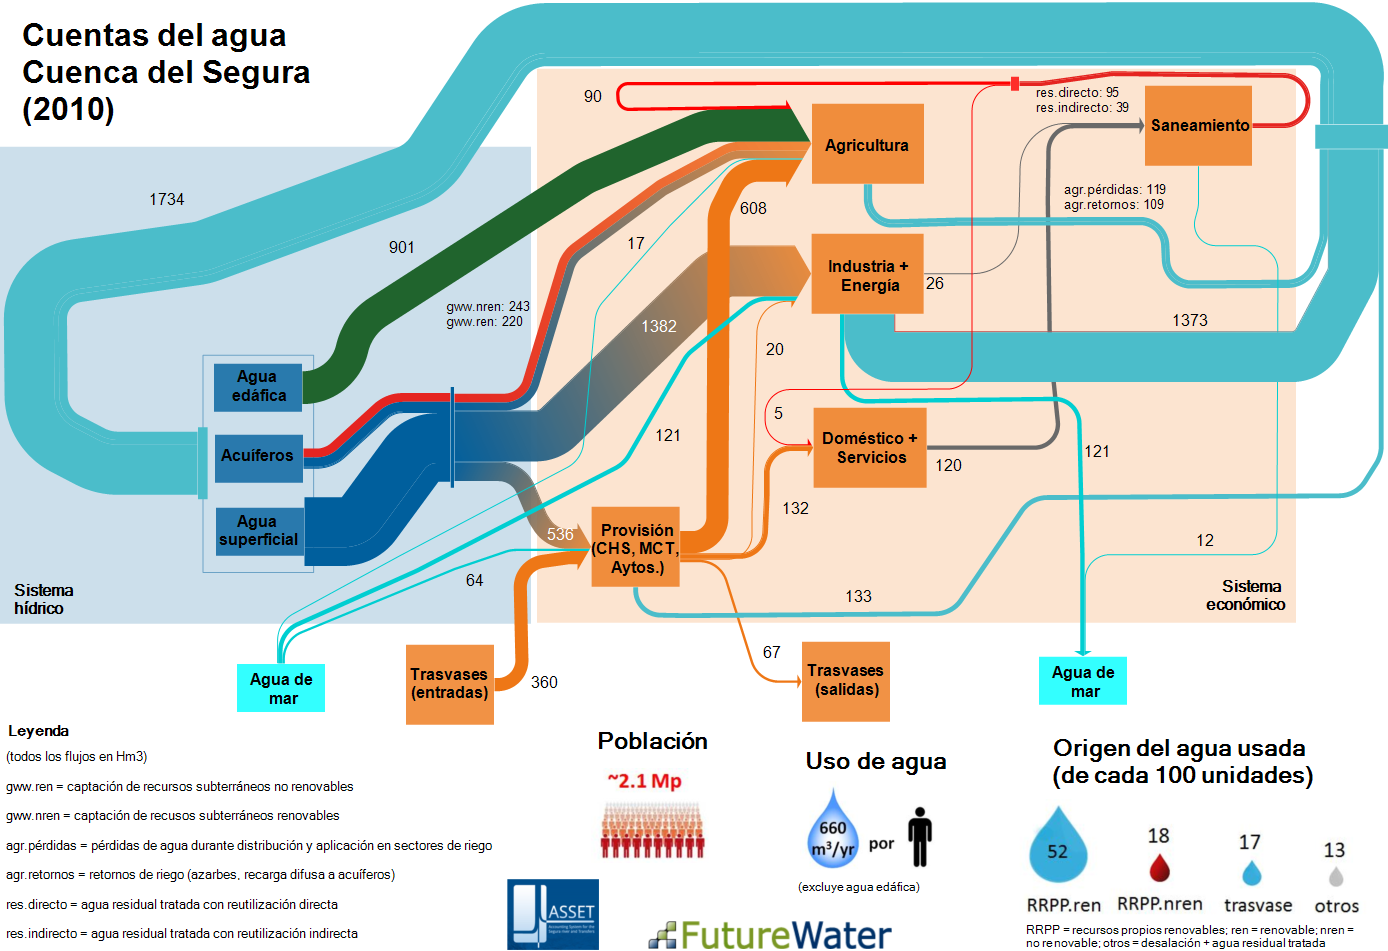
This Sankey diagram for the water system of Segura river in Spain shows “the interchanged fluxes between the hydrological and the economical system”.

This is an output from the EU-funded ASSET (Accounting System for the SEgura river and Transfers) research project and can be found on the FutureWater website. Authored by Sergio Contreras and Johannes Hunink of Future Water (Contreras, S., J.E. Hunink. 2015. Water accounting at the basin scale: water use and supply (2000-2010) in the Segura River Basin using the SEEA framework. FutureWater Report 138).

Flows are for 2010 and measured in cubic hectometres (hm³, 1 hm³ = 1000000 m3 = 1 GL). The left part with the light blue backdrop is the actual hydric sector, while the right side with the light orange backdrop encompasses the technical/economic sector.

Water is extracted from surface waters (agua de superficie), ground water (acuiferos), and – interesting pespective – from soil water (água edáfica). Water from soil (green arrow, 901 hm³) is directly taken up by plants, so consumption is in the agricultural sector only. Agriculture is the largest consuming sector, followed by industry and energy generation, and water provision to households.

Much of the releases of water from industry and energy generation is returned to the water system (1734 hm³).

Additional tidbits of information below the Sankey diagram almost turn this into an infographic.