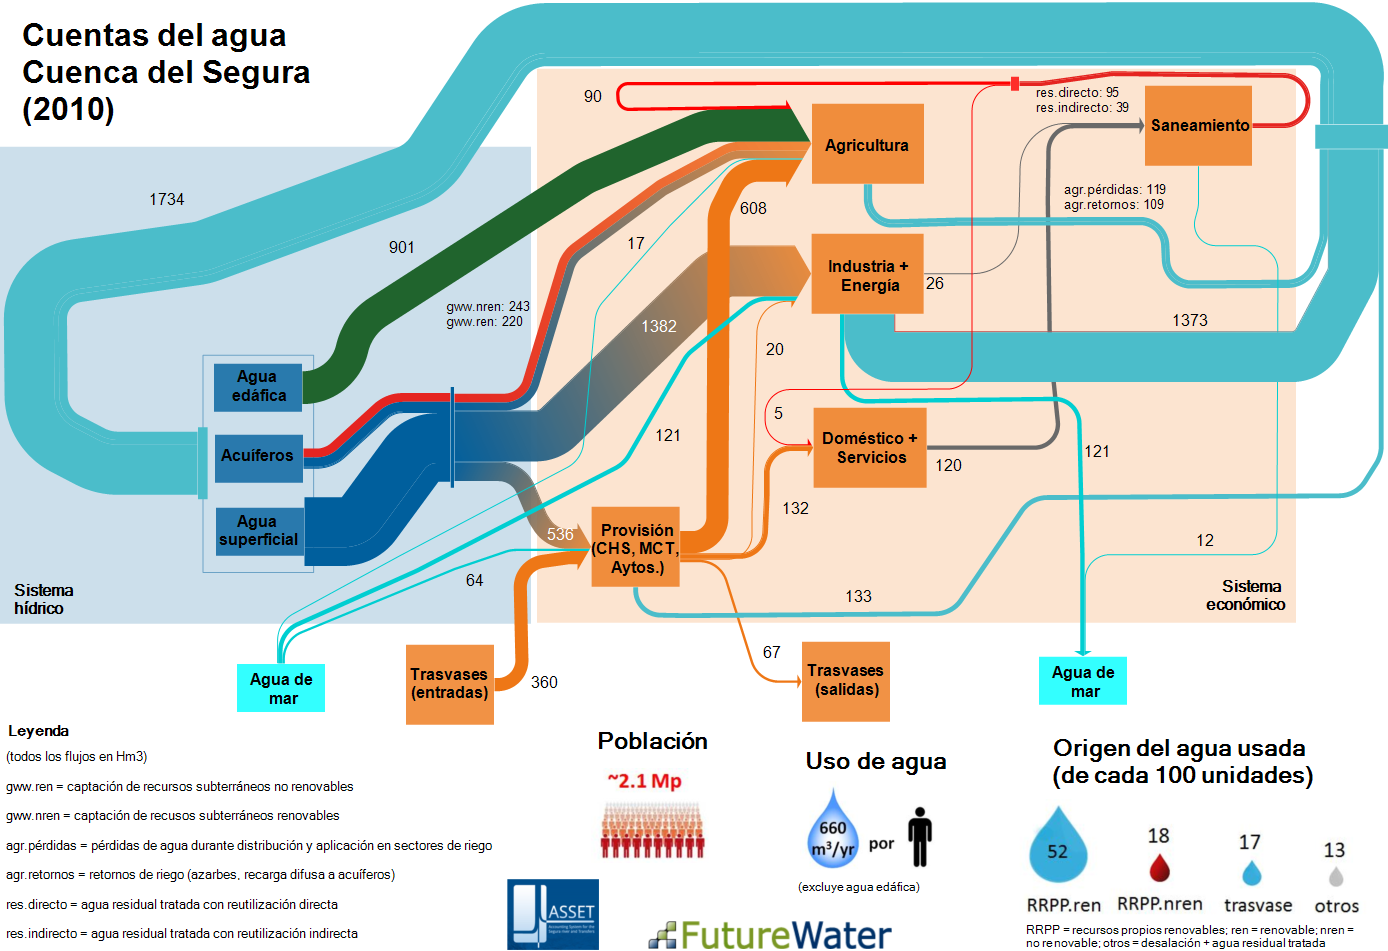
This Sankey diagram for the water system of Segura river in Spain shows “the interchanged fluxes between the hydrological and the economical system”.
This is an output from the EU-funded ASSET (Accounting System for the SEgura river and Transfers) research project and can be found on the FutureWater website. Authored by Sergio Contreras and Johannes Hunink of Future Water (Contreras, S., J.E. Hunink. 2015. Water accounting at the basin scale: water use and supply (2000-2010) in the Segura River Basin using the SEEA framework. FutureWater Report 138).
Flows are for 2010 and measured in cubic hectometres (hm³, 1 hm³ = 1000000 m3 = 1 GL). The left part with the light blue backdrop is the actual hydric sector, while the right side with the light orange backdrop encompasses the technical/economic sector.
Water is extracted from surface waters (agua de superficie), ground water (acuiferos), and – interesting pespective – from soil water (água edáfica). Water from soil (green arrow, 901 hm³) is directly taken up by plants, so consumption is in the agricultural sector only. Agriculture is the largest consuming sector, followed by industry and energy generation, and water provision to households.
Much of the releases of water from industry and energy generation is returned to the water system (1734 hm³).
Additional tidbits of information below the Sankey diagram almost turn this into an infographic.
