Category: History

1913 public transport 3D map

Leafing through Brinton’s 1914 book ‘Graphic methods for presenting facts’ I found this example of a 3D map that has elements of a Sankey diagram.

This map (photo taken from an exhibit at a 1913 exhibition) shows passenger numbers on the Frankfurt streetcar lines (back then when trams were still called streetcars!)


Brinton explains that “we have a map presentation in which quantities are represented by building vertically above the various routes laid out on the map … made by strips of wood, alternately black and white, glued carefully above each one of the street-car routes. Each of the strips of wood represents 4,000 passengers carried on the street-car lines in 24 hours” (page 224).

The built up flows showing passenger numbers would, if laid sideways, indeed make a Sankey diagram. Building them up using the third map dimension avoids the issue of dealing with wide Sankey arrows in a dense city center, where passenger numbers are highest.

Brinton’s book, although over 105 years from its publication still makes for a great read (as does his 1939 book on ‘Graphic Presentation’, which is basically a sample book for doing infographics).
World Energy Flows in 1937

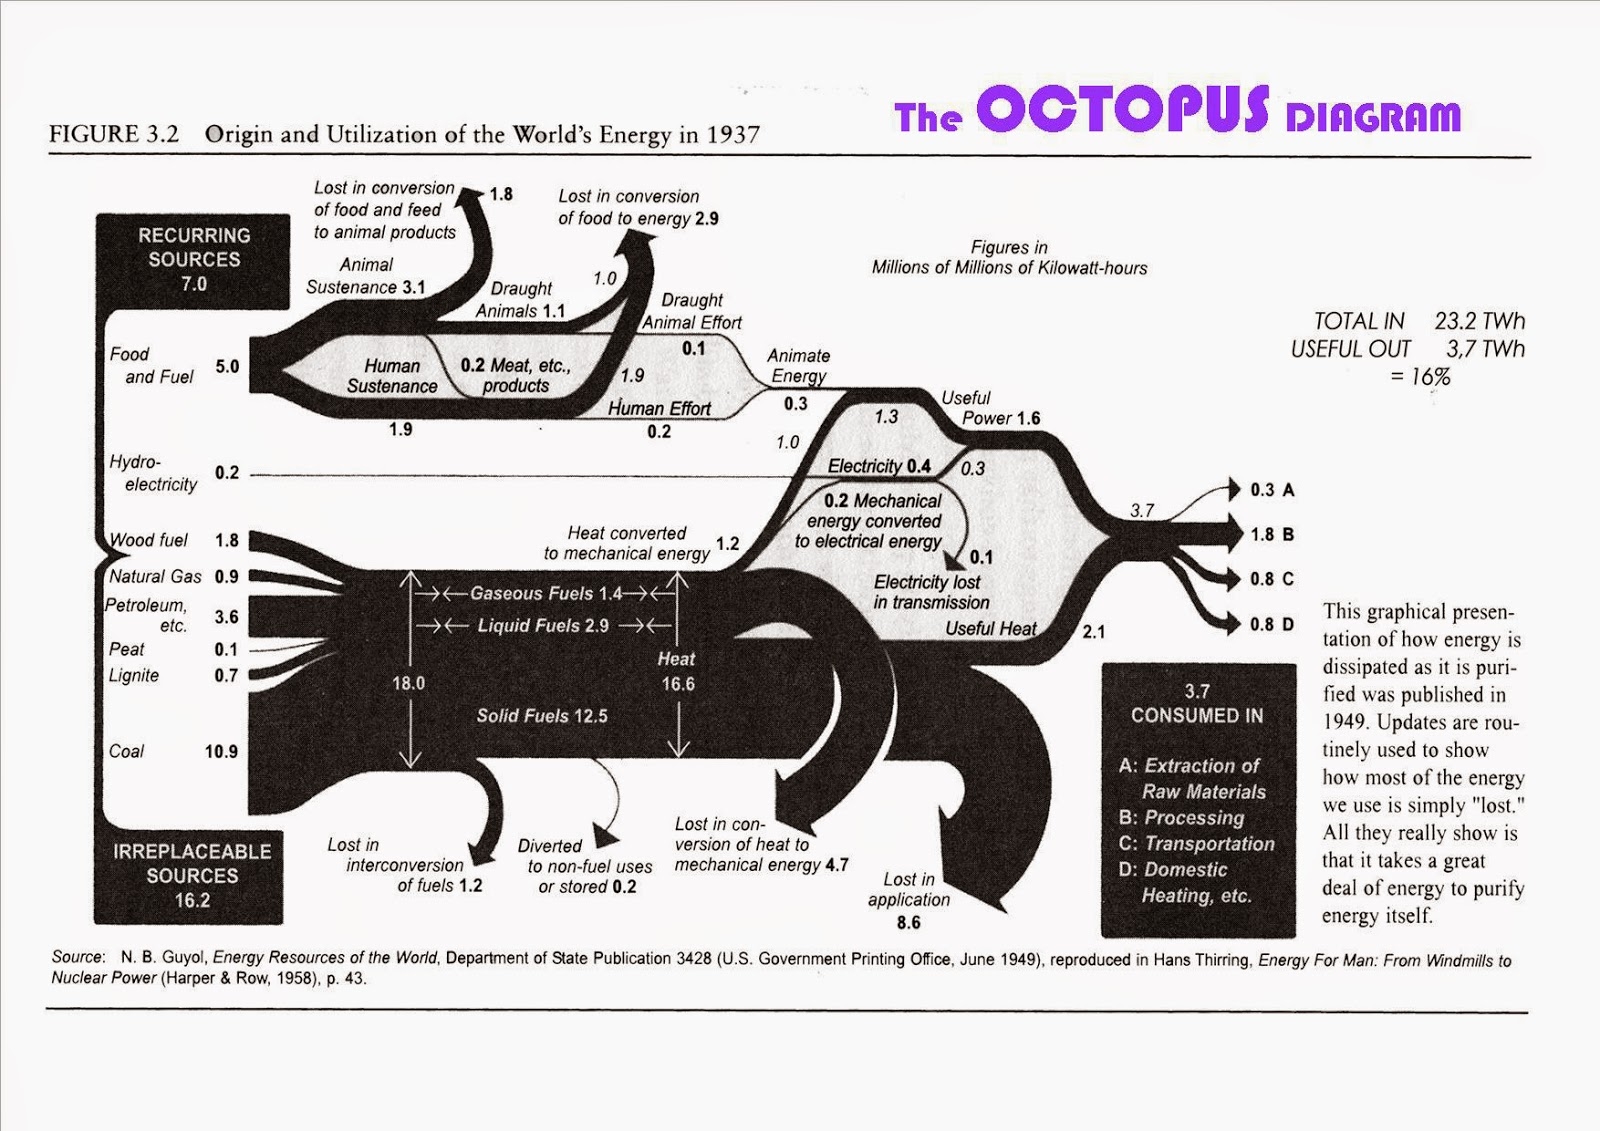
The below Sankey diagram from 1949 depicting world’s energy flows in 1937 is shown in this blog post by Michael Hohmann | LMH Design.


Flows are in TWh.
Michael says: “When I first saw this, I was reminded of seeing an octopus and called it an Octopus Diagram, with the octopus’ head at the input end at left, and the tentacles on the right, in between digesting and distributing everything that the various mouths at the head can gobble up”, asking himself “[w]here does all this Input energy disappear to with so little Output energy ending up as useful for us humans?”.

Minard’s 1858 Map of World Migration

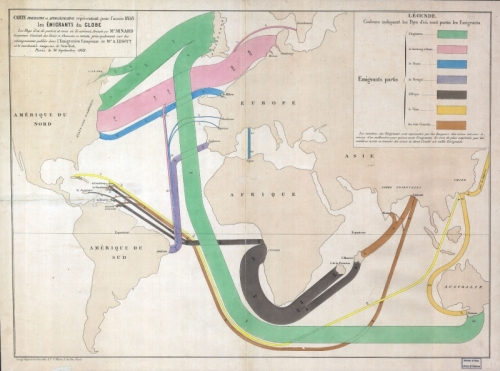
Martin Grandjean digitized and vectorized Charles Joseph Minard’s World Map of Migration from 1862. His recent post reminds us that no too long ago migrants were also moving from Europe to other places of the world.

via martingrandjean.ch – full vectorized image 2 MB here

The map, based on data for the year 1858, “shows migration flows that contrast with the maps of the twenty-first century. That year, 86.000 Englishmen left their country, as 45.300 Germans, 20.000 French and 11.600 Portuguese.”

Read this interesting post from the Cartographia blog for additional detail on the map.

From a technical point of view, the only criticism I have of Minard’s map is that the direction of the arrows is not indicated. It requires the reader to know about origins or destinations of migration.

You can see the original Minard migration map (“Carte figurative et approximative représentant pour l’année 1858 les émigrants du globe, les pays dóu ils partent et ceux oú ils arrivent”) in this 2009 post and at Wiki Commons or directly at the Library of Congress.

You might want to check out another related June 2015 article by Martin Grandjean, where he points out some shortcomings of migration maps.

1970ies Energy Time Series in 3D

The Energy Education References Wiki has a page on Sankey diagrams. It features many samples, snippets and links directed at teachers.

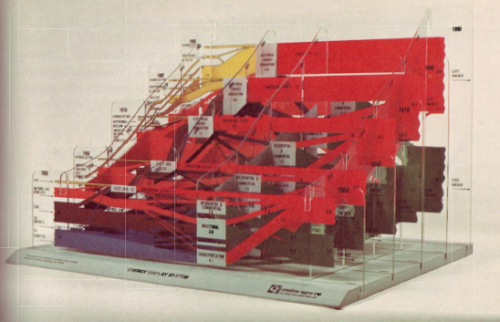
One image in particular caught my attention. This is described as “Energy Display System” created by CSIS in the 70s


(via Energy Education References Wiki)

You all know those national energy flow Sankey diagrams I show here regularly? Now imagine the same type of image as a series consecutive frames for several years. This would produce a kind of animated gif or movie showing changes over time.

The above must be an early 3D version of this. The diagrams are mounted on what seems to be acrylic glass…

Cartographia blog shows Minard maps

In 2008, the Cartographia blog started a post series called ‘Monday’s with Minard’. Some people consider Charles Joseph Minard the first to use arrow magnitude in his diagrams to represent quantities. (As a consequence, this means that Sankey diagrams would have to be renamed to Minard diagrams!).

What differentiates Minard maps from Sankey diagrams is that Minard’s fine works always have a geographical relation. The most famous one is his Map of Napoleon’s march to Moscow published in 1869. This “carte figurative des pertes successives en hommes de l’Armée Francaise dans la campagne de Russie 1812-13” shows number of men (as width of arrows), geographic movement of the troops on the map both for invasion as well as for retreat, as well as time and temperature on a separate scale.

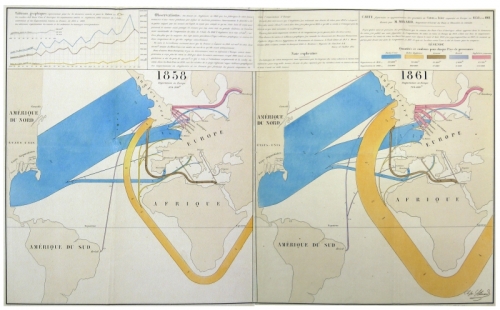
Cartographia blog has some other nice examples, two of which are shown here:

The first shows migration patterns across the globe. Arrows do not have an arrow head but the country of emigration is color coded. The outline of the countries is distorted to accomoadate large flows connected to them. For a detailed description please consider reading the original blog post. This map is similar to the one I showed in this post.

The other is a flow map for wool and cotton for the years 1858 and 1861. “Blue represents cotton and wool from the United States, the orange from British territories in South Asia … One millimeter represents 5,000 tons of cotton or wool.”. As one can see on the 1861 map, cotton imports from Asia have increased dramatically. See the description of the map in the blog post on Cartographia blog.

See all Monday’s with Minard posts here. There has been no activity on the blog since June 2008. I hope to see more of these posts some day.

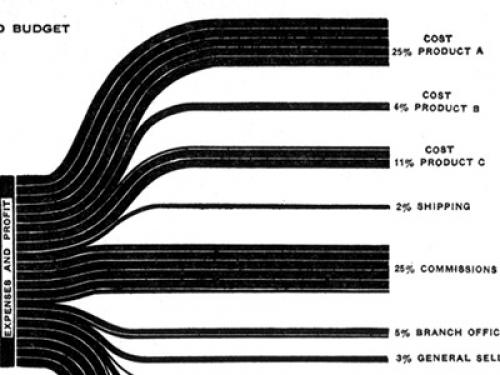
Estimated Budget Chart

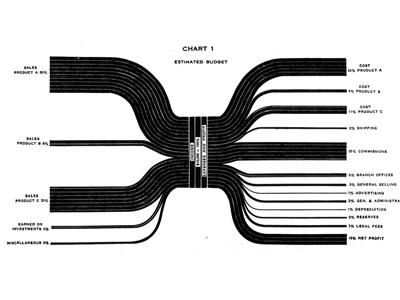
A similar Sankey-style diagram to the one I presented in my last post can be found on the visualcomplexity.com website.

It shows the estimated budgeted costs and earnings and was published by IBM back in 1940 (original source: H. Arkin, Graphs: How to make and use them (Harper & Brothers Publishers, New York, ed. Revised, 1940).

I am not sure if this fully qualifies as a Sankey diagram, since the flows are not directional. The earnings from sales of different products are broken down into arrows of different magnitude from/to the left. Costs for producing the products and overhead costs are on the right side. This chart thus constitutes a graphical representation of an accounting system, with values given in percent rather than as absolute figures.

These distribution diagrams are also known as ‘Spaghetti diagrams’. See this detail:

Manuel Lima’s visualcomplexity website has more interesting diagrams, and one can spend hours browsing the projects. I will be presenting a few more of them that qualify as Sankey diagrams here on the blog in the future.

The first Sankey diagram

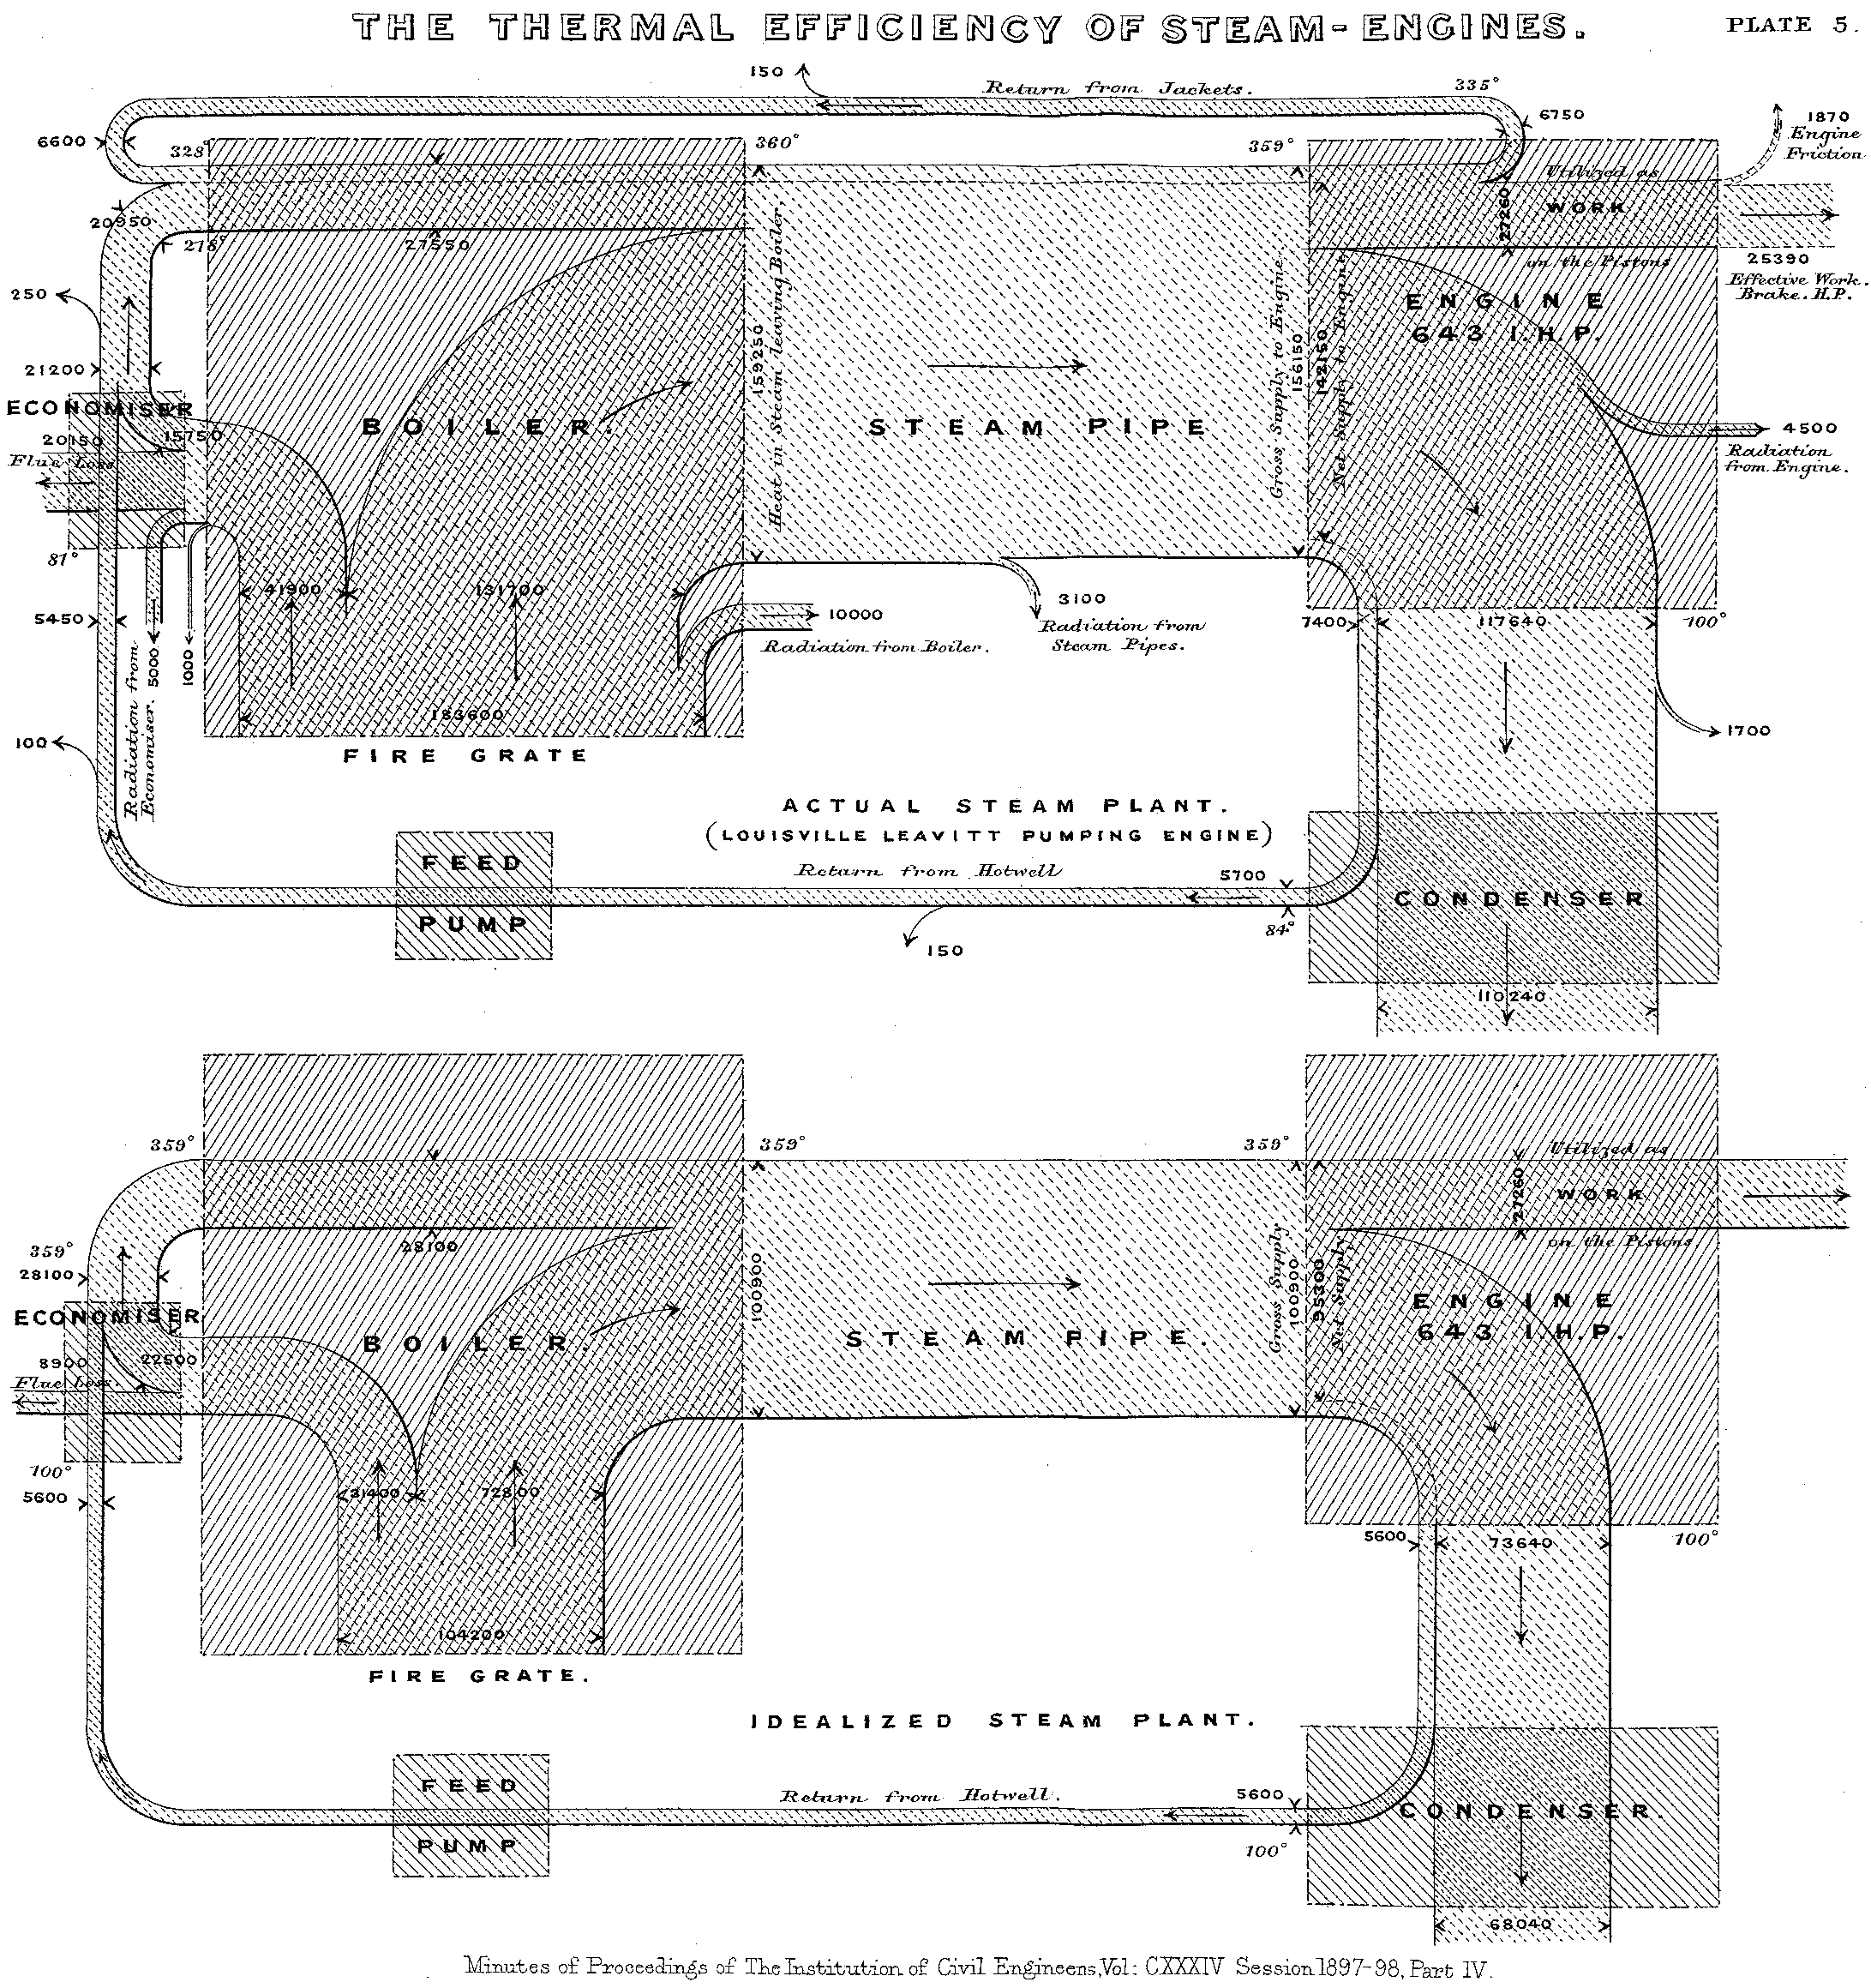
A scan of one of the first – if not THE first ever – published Sankey diagrams has now been added to the Dutch and German Wikipedia articles. Actually I had always wanted to get hold of a digital version of this this energy efficiency diagram published by Captain Henry R. Sankey in 1898 in the Minutes of Proceedings of The Institution of Civil Engineers. Vol. CXXXIV, Session 1897-98. Part IV.

First Sankey diagram published 1898 in JIE (Source: Wiki Commons)

Click here to see the image in original size.

Sankey used this novel type of diagram to represent energy flows and energy losses in a steam engine, comparing it to an ideal steam engine.