Tag: China

China Pearl River Delta Water System

A follower of this blog sent me an e-mail with a Sankey diagram. I think it deserves to be presented here.

He writes [original e-mail, wording slightly modified by me]:

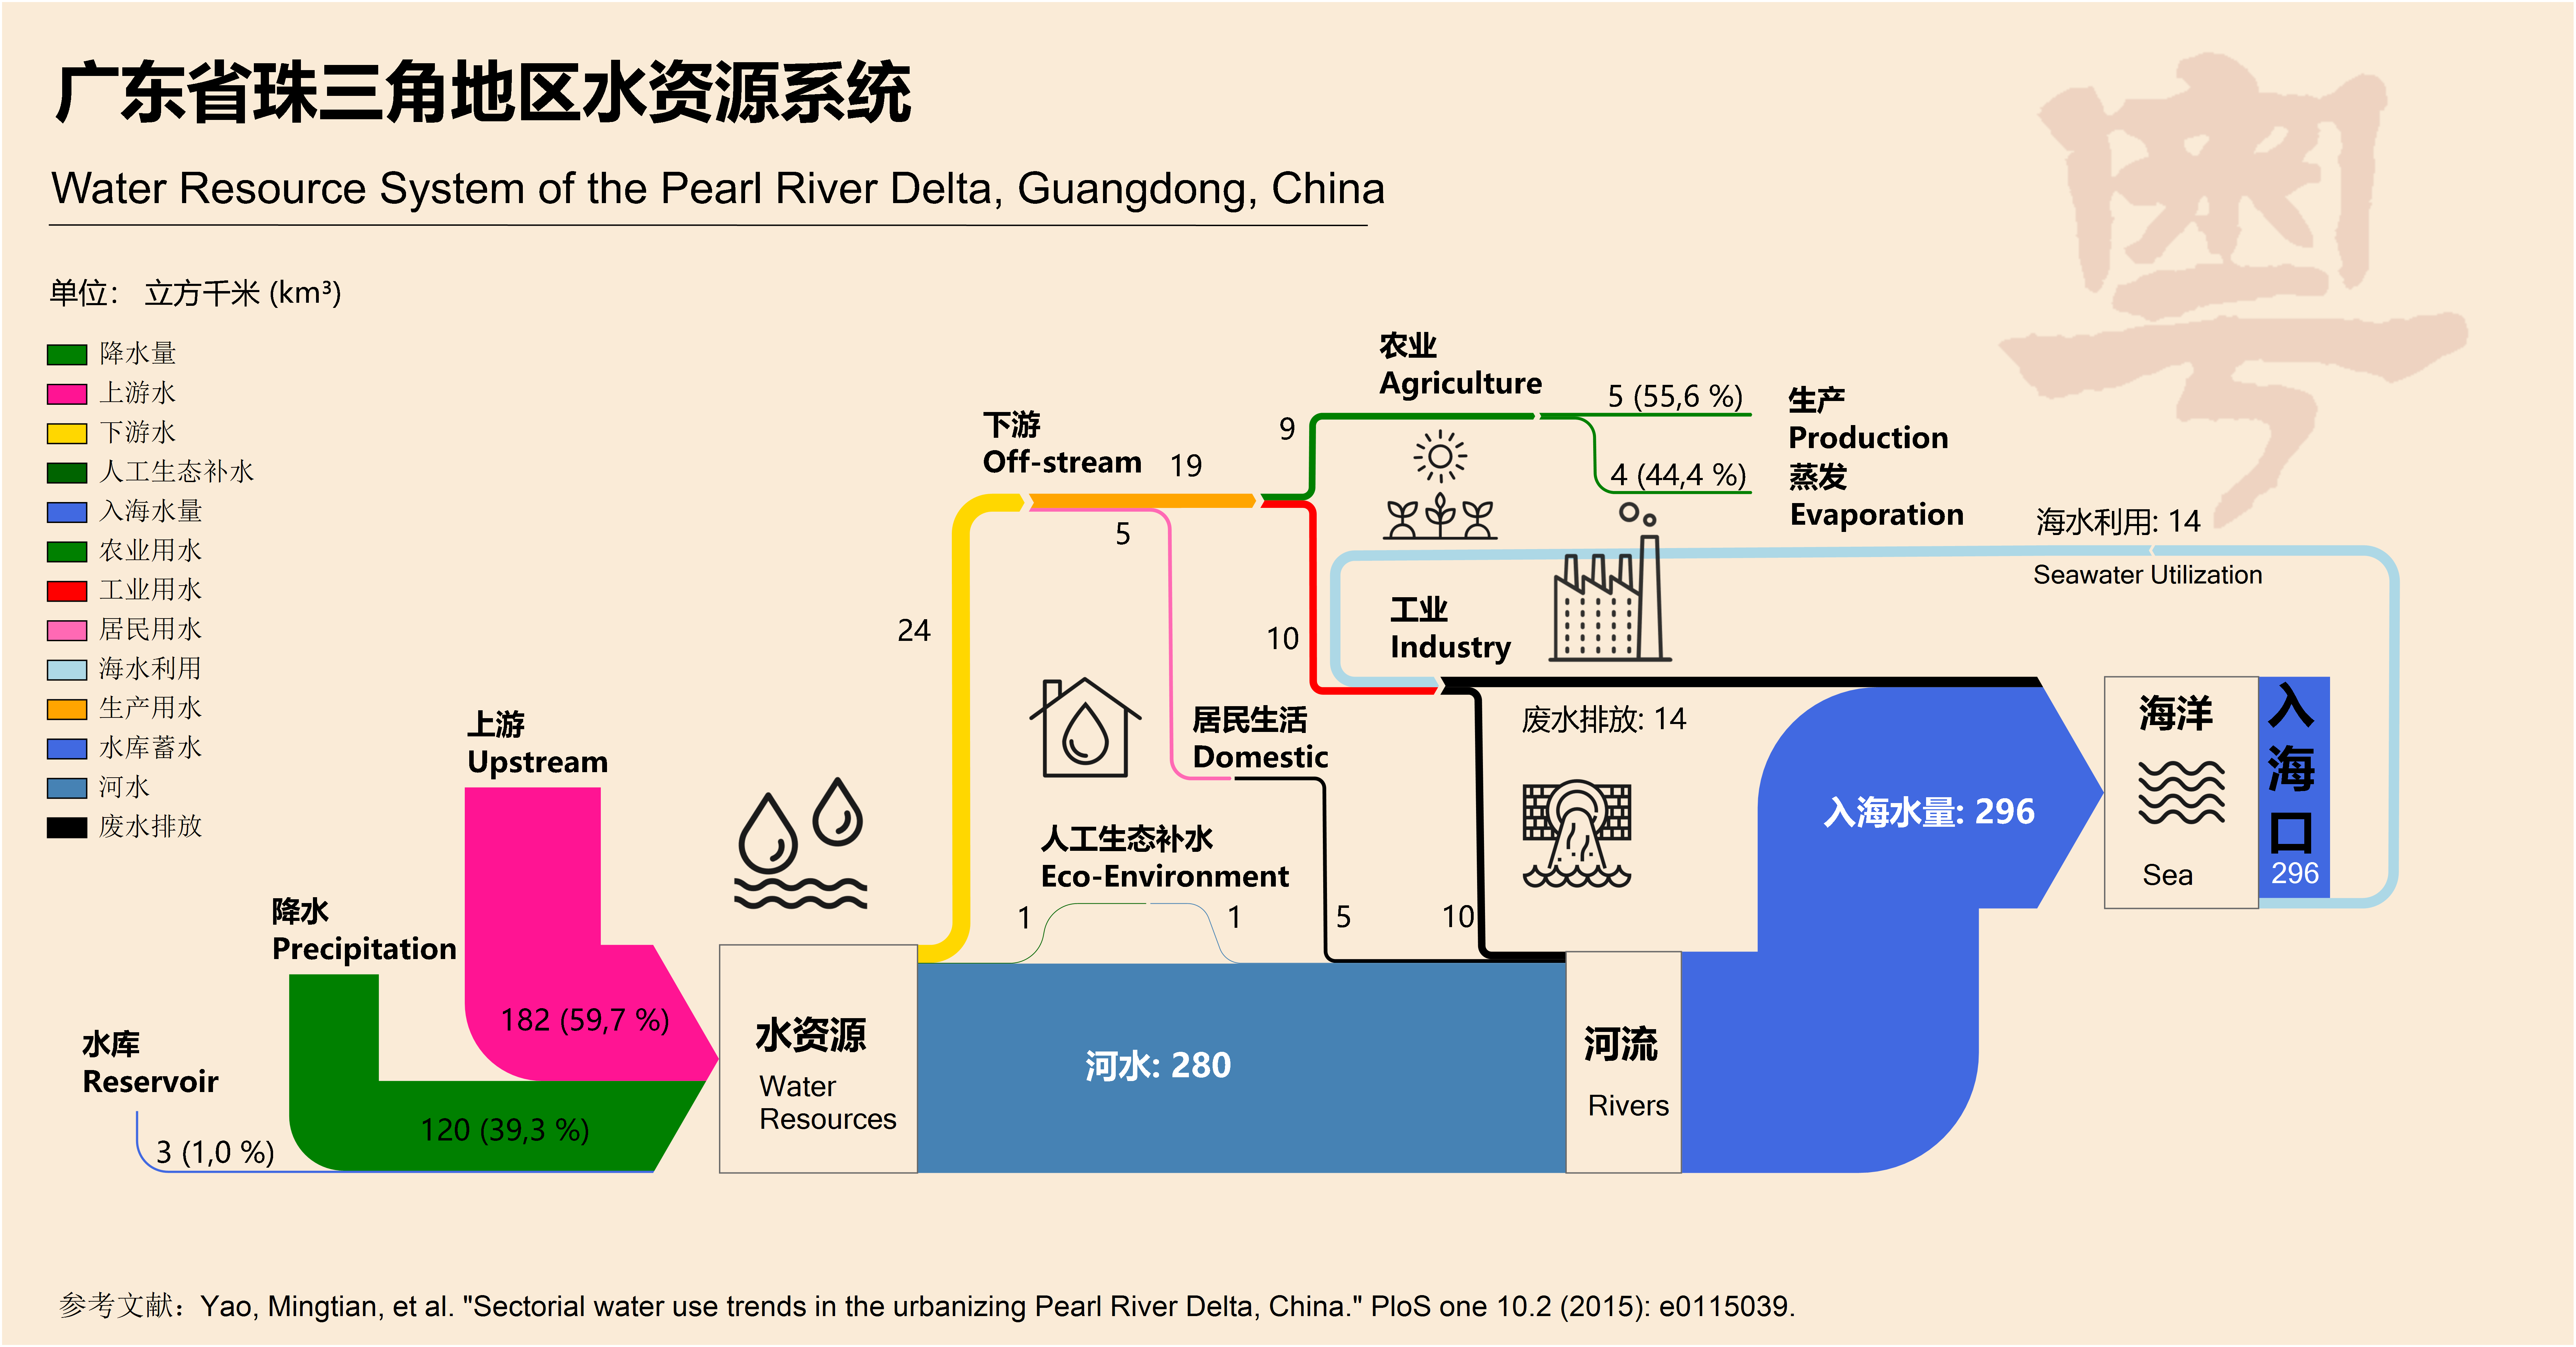
… I was inspired to do this by the Water Use in Qingdao post on your blog. When I discovered an article that had a schematic figure of the Pearl river water use system in my home province Guandong (广东省) I took on the task to create a nice Sankey diagram. I hope you like it. You are free to use it on your blog.

This is the original figure from an open access article Yao M, Werners SE, Hutjes RWA, Kabat P, Huang H (2015) Sectorial Water Use Trends in the Urbanizing Pearl River Delta, China. PLoS ONE 10(2):e0115039.doi:10.1371/journal.pone.0115039.

And here is the Sankey diagram that he created.

Flows are im cubic kilometres (km³) per year. Most of the water (280 km³), both from the upstream river and precipitation in the area, runs directly into the sea. A comparatively small part (24 km³) is taken for industry, agriculture and domestic use. Some water (14 km³) is also extracted from the sea for industry (cooling?).

Nicely done, somewhat colorful … I like! Thanks for sending this to me to share it with the public. A worthy farewell Sankey diagram…
China Carbon Emissions from Energy

Energy generation in China is dominated by the use of hard coal. This Sankey diagram is from an article titled ‘A Method for Analyzing Energy-Related Carbon Emissions and the Structural Changes: A Case Study of China from 2005 to 2015’ by Honghua Yang, Linwei Ma and Zheng Li (Tsinghua University) in: Energies 2020, 13, 2076; doi:10.3390/en13082076. It shows carbon flow and emissions (I take that as CO2 only, although it might include CH4 if biogas was used)


Published under the terms and conditions of the Creative Commons Attribution(CC BY 4.0) license

Depicted are energy-related carbon flows in China in 2015. Unit of flow is 10 Mt C, which in the last column also translates into Mt CO2.

The sectors Transport (“Vehicle”), Industry (“Factory”) and Buildings are further broken down into the individual services the energy provides, like illumination, thermal comfort, hygiene.

There is another energy flow diagram for China in 2015 in this article, and it shows that there are also other energy sources (hydro, wind, nuclear, solar), but these don’t show up in the carbon flow diagram.

Resource Imports into China 2014

With all the news and discussions about trade balance and tariffs and exports of goods from China to the U.S. we mustn’t forget that China is also a large importer of resources from all over the world.

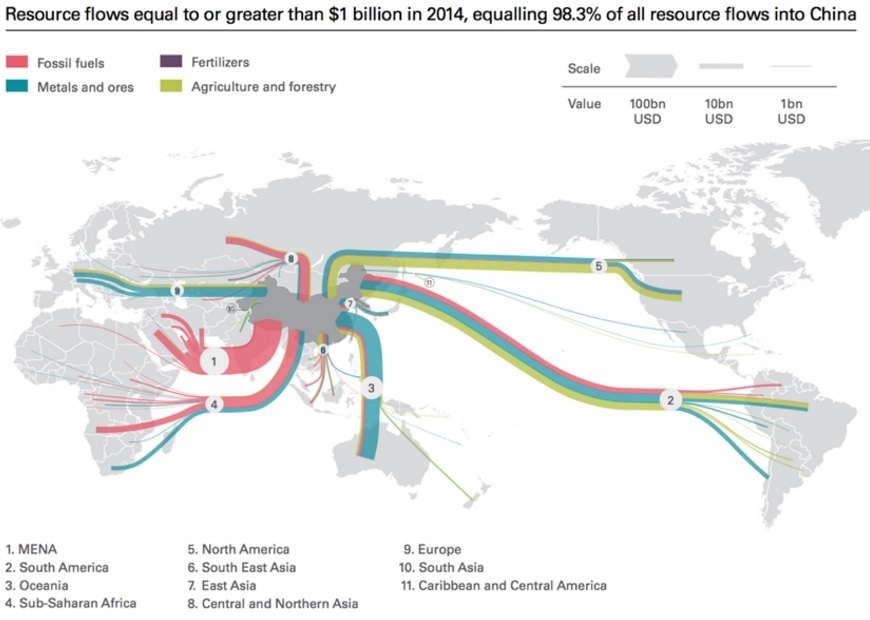
The below Sankey diagram is a good visualization of the resource dependencies and import such as fossil fuels, minerals and ores, as well as agricultural / forestry products. I found it in an article on the Diálogo Chino blog but it was originally published in a 2016 report ‘Navigating the New Normal: China and Global Resource Governance’ by Wei Jigang et. al. published jointly by Development Research Center (DRC) of the State Council of the People’s Republic of China and The Royal Institute of International Affairs Chatham House. The image from an article ‘Will China’s new Silk Road be green?’ by Lily Pike on Diálogo Chino is republished under a Creative Commons license.

All Sankey arrows run towards China (imports in 2014) and flows are color-coded to show the resource type. There are no absolute numbers, but the value of goods imported in billions of USD is represented with a clustered scale that shows three representatives 100 bn USD, 10 bn USD, and 1 bn USD. The largest (in terms of value) stream is from the Middle East, while Latin America and Australia are the second and third largest regions delivering resources to China.

The original report is here with the image on page 64 and more detail on the data.

Misc Sankey Diagrams Uncommented 17

Baidu Zhidao (“Baidu Knows”) is the Chinese version of a Q&A website (like quora.com or answers.com), where users can post a question and others from the community answer it.

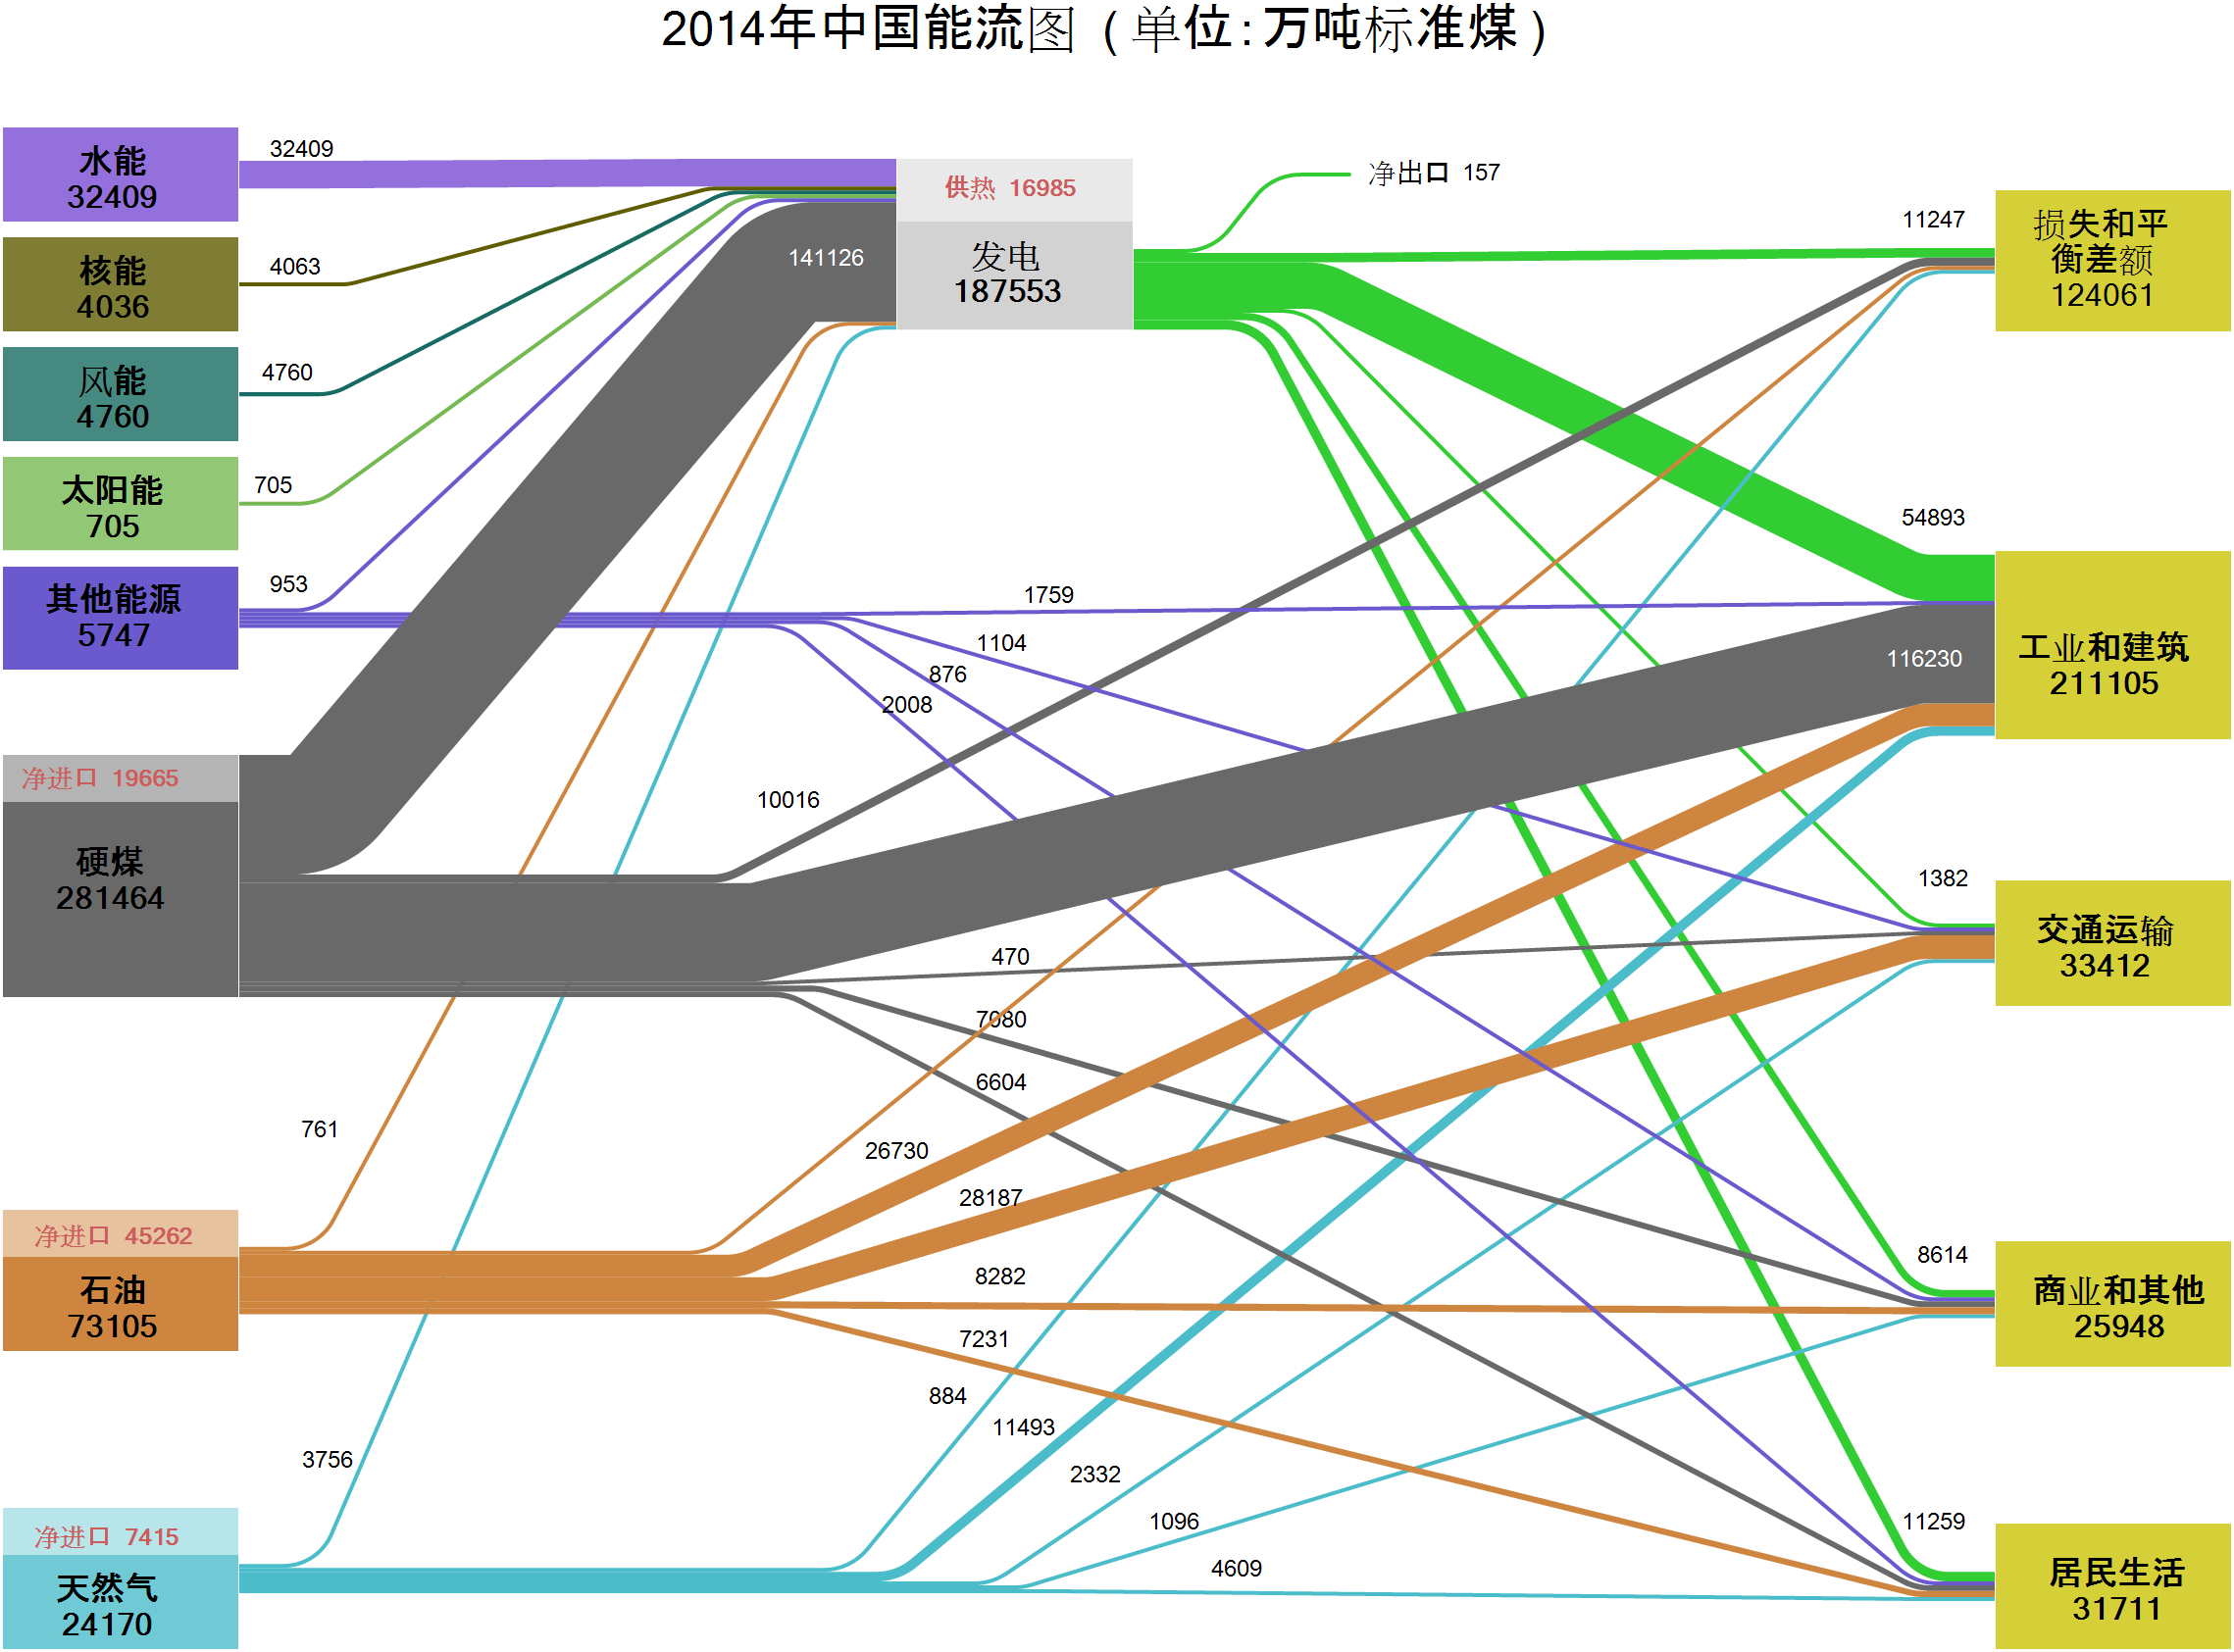
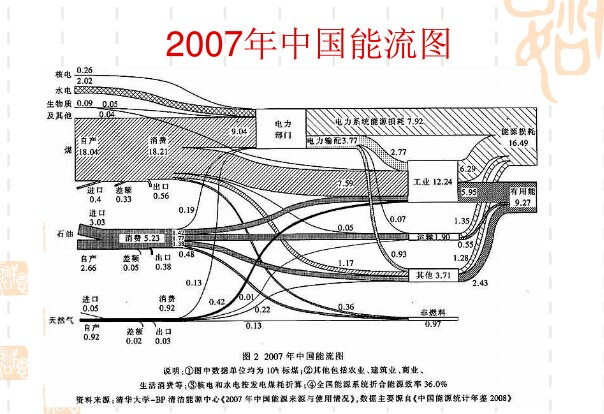
Here’s someone asking whether there is a China-made Sankey diagram software. This nice diagram is shown to explain what a Sankey diagram looks like. Please don’t ask me what is actually visualized here…


Source: Baidu Knows (百度知道)

China Energy Flows 1971 and 2010

The article ‘Understanding China’s past and future energy demand: An exergy efficiency and decomposition analysis’ by Paul E. Brockway, Julia K. Steinberger, John R. Barrett, and Timothy J. Foxon (all of Sustainability Research Institute, School of Earth and Environment, University of Leeds, UK) appeared in Applied Energy 155:892-903 in October 2015 and features a comparison of China’s energy use in 1971 and 2010. These Sankey diagrams were drawn up to show “the overall flow of exergy to end useful work, and the exergy losses that occur during the various conversion processes”.

China’s energy usage is roughly tenfold in 2010 compared to 40 years ago (37 Mtoe up to 355 Mtoe). Not sure whether both diagrams are setup on the same scale but judging from e.g. the black coal flow (140 Mtoe in 1971, 577 Mtoe in 2010) that is about 4 times wider, I would say they are.

Another interesting detail in these diagrams is that the authors have included food and feed as energy source. This is the first time I see this in a national energy flow map. Given that the energy content of this “fuel” is higher than both combustible renewables and renewables together, it seems justified to include it. The efficiency of turning food and feed energy into muscle work, however, is very low (approx. 3%).

I invite you to read the full article (open access) and to comment on the Sankey diagrams shown in Appendix B.

Water Use in Qingdao, China

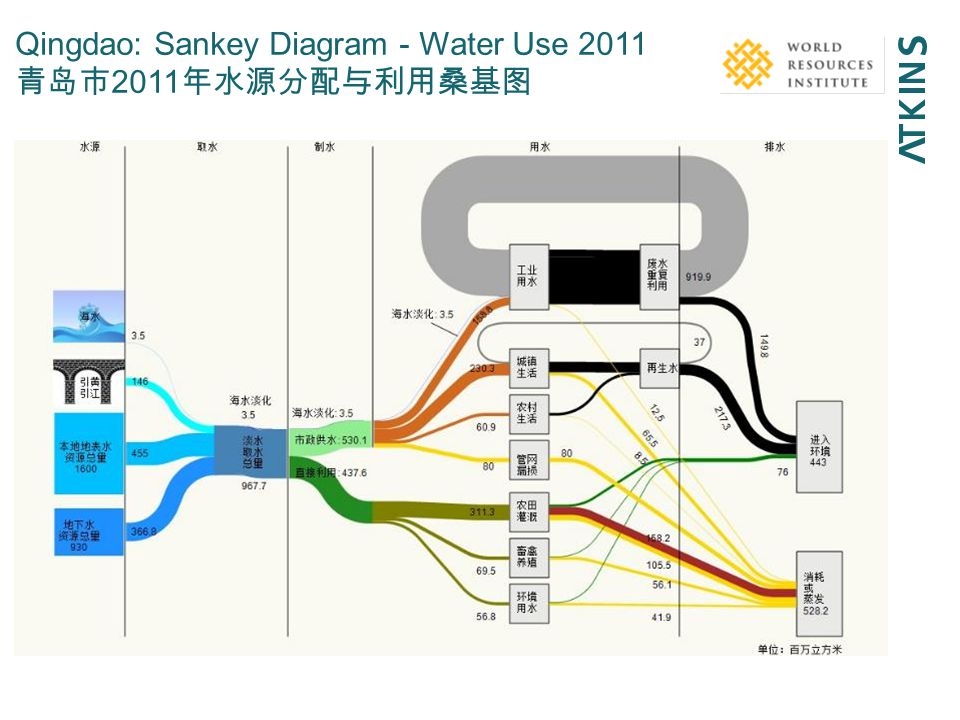
Interesting Sankey diagram on water use in Qingdao, China in 2011. This is from a presentation titled ‘Urban water security – Water-energy-food nexus’ by Josh Weinberg of Stockholm International Water Institute. Atkins and World Resources Institute (WRI) appear as co-authors.

Unit of flow seems to be million m³ (百万立方米). Water origin is mainly surface water (455 mio m³) and local ground water (367 mio m³), with some additional (146 mio m³) brought in from Yellow River and Yangtze River.

Not sure about the split shown with two green flows, possibly breaking down the water use to urban (city of Qingdao) and province.

The middle part shows consumers: Farming (?) is largest consumer with 311 mio m³ per year, followed by ??? with 230 mio m³, and use in industry with 153 mio m³. Polluted water is shown in black.

Maybe someone who reads Chinese wants to chime in…

Graedel REE wheel Sankey remake

In this post on rare earths I have recently featured an alluvial diagram depicting rare earths use from a presentation by T.E.Graedel (Yale). That same presentation also lead me to another article by X. Du & T.E. Graedel titled ‘Uncovering the Global Life Cycles of the Rare Earths Elements’ (open access) that has a number of circular flow diagrams I would call “REE wheels”.

The article describes how quantitative data on rare earths is available for mining and processing, but “very little quantitative information is available concerning the subsequent life cycle stages”. Also, data is mostly available for the overall REE production, but not individually for every single rare earth element. They therefore aim to estimate and approximate the quantities for ten REEs, based on sources from China and Japan.

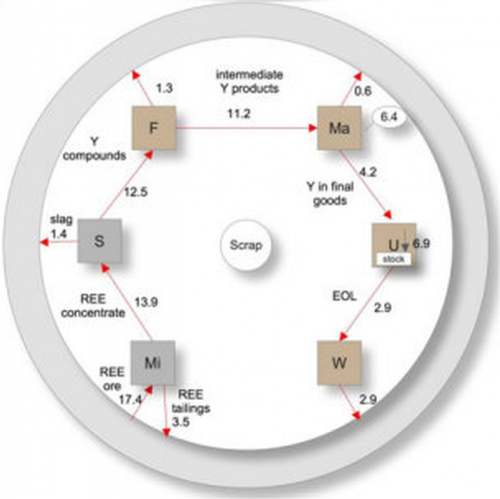
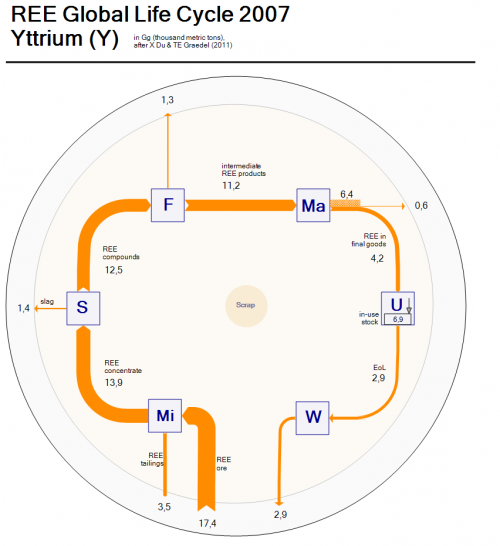
Here is the REE wheel for Yttrium (element Y) from the article:

The diagram can be read from 7 o’clock to 5 o’clock in a clockwise direction. The processing steps are “Mi” (mining), “S” (separation), “F”(fabrication), “Ma” (manufacturing), “U” (use) and “W” (waste management), thus showing the flow of the rare earth element through the economic cycle.

I did a Sankey diagram version of the above Yttrium REE wheel to have the arrow magnitude representing the quantities. Flows are in Gigagrams (million metric tons) per year.

Due to the fact that the arrows connect horizontally and vertically to the node (and do not run diagonally like in the original) my remake looks less “circular” somehow… in fact it resembles more one of those retro indoor AM/FM loop antennas you would hook to your HiFi. So I am not fully satisfied with the outcome. Would it be better if the nodes were tilted 45°?

What’s nice is that the extraction of ore (17.4 Gg) can be directly compared to the 2.9 Gg Yttrium release to the environment. I switched ore input and tailings output at the mining node to have them side-by-side.

Comments and improvement suggestions welcomed.