I had previously reported on Sankey diagrams being used in articles on circular economy (earlier this year in January and back in 2013). Researchers in the field of MFA, circular economy and urban mining apparently love to use them…
Here is another one from an article by Willi Haas et.al. published a few weeks ago (How Circular is the Global Economy?: An Assessment of Material Flows, Waste Production, and Recycling in the European Union and the World in 2005; DOI: 10.1111/jiec.12244).
Open Access @ Journal of Industrial Ecology, via Green Manufacturing blog
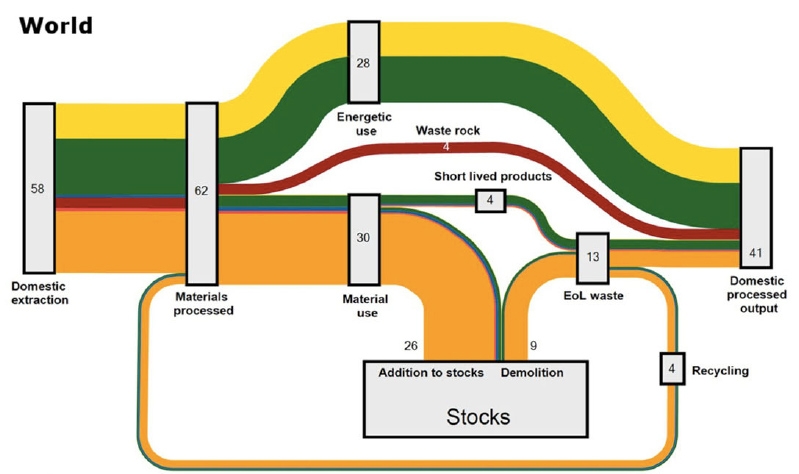
The answer to the question raised in the title is answered visually: Not very circular!
The above Sankey diagram is for “all societal material flows globally”, world mass flows moved by mankind. 62 gigatonnes (Gt) of material processed, out of which 58 Gt are newly extracted, and only 4 Gt recycled. “From such a system-wide metabolic perspective, the degree of circularity of the global economy measured as the share of actually recycled materials in total processed materials appears to be very low, at 6%.”
Fossil fuels (yellow) are converted to energy, most biomass (green) ends up as gaseous emissions or solid waste. Construction materials are in orange and metals in blue and these add to stocks of buildings, infrastructures, and other goods with a lifetime longer than a year. The two red arrows are for industrial minerals and “waste rock” (would that be tailings from mining?). Note: The legend is cut off in the screengrab above (please check the original article, page 6).
Interesting article, make sure you read it (open access). It also features a second similar Sankey diagram for Europe (EU-27). Beautiful and intelligent use of a Sankey diagram.
