Yesterday it became known that the European Commission would shelve their circular economy package of waste, recycling and incineration laws for now, in favour of an even more ambitious legislation to be presented by end-2015 (read here or here).
That led me to browse tweets using the hashtag #circulareconomy, and I ended up unearthing two nice Sankey diagrams…
The first one is by WRAP UK, showing the EU-27 material flows estimated in 2020. This is not for a specific type of material, but all material.
Flows are in million tonnes, with the 2020 values in blue, and the current (2010) figures in brackets below for comparison. There are three nodes: ‘Direct Material Input’, ‘Domestic Material Consumption’ and ‘Waste’. Unfortunately the size of the node icons is too large, and the flows are difficult to see. But still, this is a nice idea!
The main message is that in comparison to 2010, Europe could have 350 million tonnes of recycled material in 2020. Check out these Sankey diagrams by WRAP UK that basically convey the same messsage, but are less infographic.
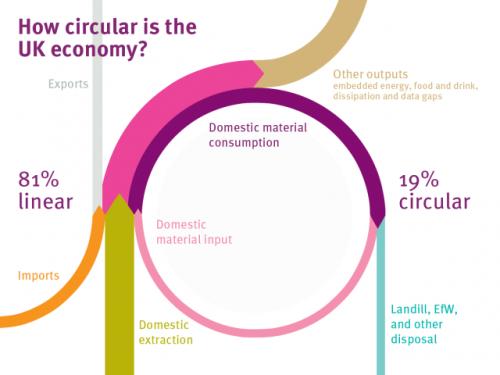
Another Sankey diagram I found when browsing through the tweets was this one below. The title of the diagram is “How circular is th UK?”.
I found it in a blog post ‘Designing Out Waste Consortium’ by Ramon Arratia on Interface’s Cut The Fluff blog on sustainability, but it is originally from this Green Alliance blog post by Julie Hill.
No values shown along the flows in this Sankey diagram, but neatly shaped circular flows. The question raised in the title is answered prominently with the message that 19% of the material in the UK is led in a loop (pink flow).
