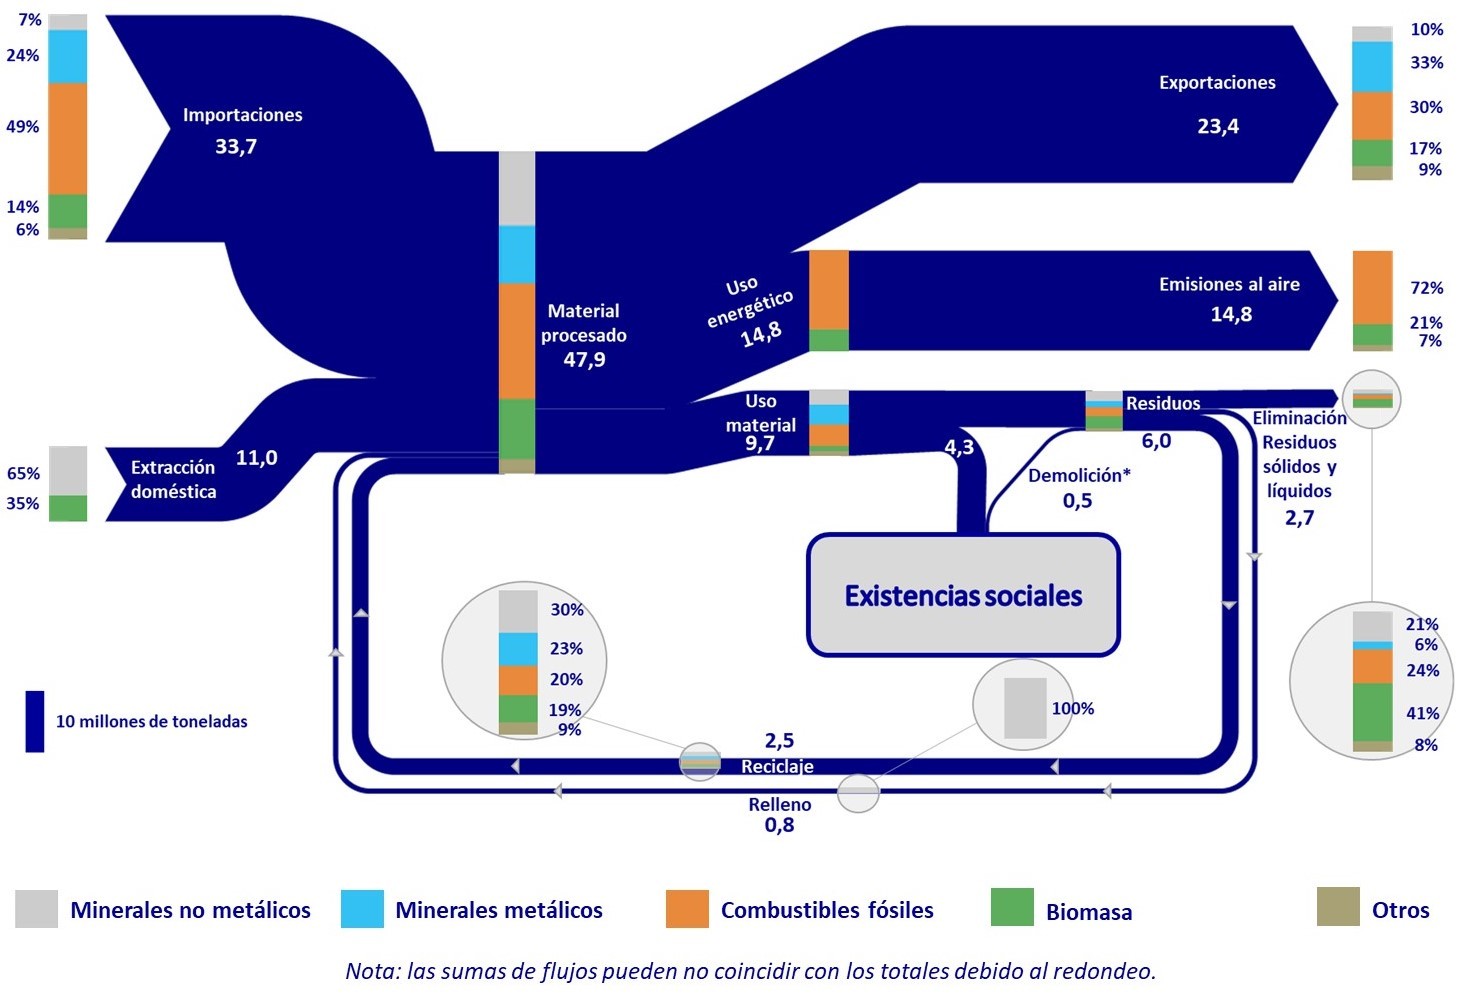
A post on the ‘Low Carbon Future’ blog by IDOM caught my attention as it featured the below Sankey diagram. The post is a summary of an event held back in 2019 on the elaboration of a Circular Economy Strategy for the Basque Country” (“Foro de participación para la elaboración de la Estrategia de Economía Circular del País Vasco 2030”).
The diagram shows mass flows in mega tonnes (Mt) for the year 2016 within the autonomous community in the North of Spain. While the arrows are unicolored, stacked bars on the streams reveal their composition with contributions from metallic minerals, non-metallic minerals, fossil fuels, biomass and others.
Somehow I couldn’t get rid of the feeling that I had seen something similar before. And indeed a similar Sankey diagram for global flows is featured in this post from 2015 and – even more so – one for EU material flows in this followup post from 2018. They seem to have served as a template for the creation of a regional Basque version.
