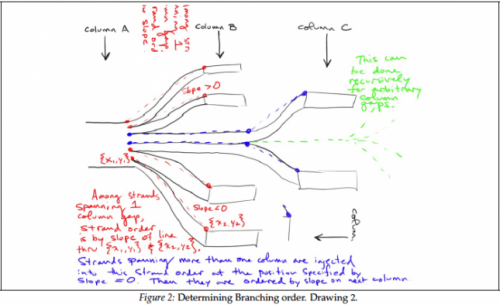
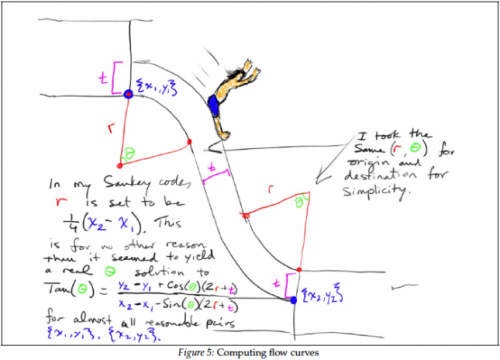
A great post on Sankey diagrams at the visualign blog led me to Sam Calisch’s PDF at github. It contains some insight on the maths behind the drawing of Sankey diagram curves, especially the type known as spaghetti diagram or distribution Sankey diagram (see discussion here).
There are some great scribbles in this paper that I wanted to share.
And I especially like this one, with the little man using the Sankey arrow as a slide…
The article is well-worth reading, so if you are into programming a Sankey software (the Mathematica workbook for Sankey might be a starting point), please download and study it.


1 Comment
Comments are closed.