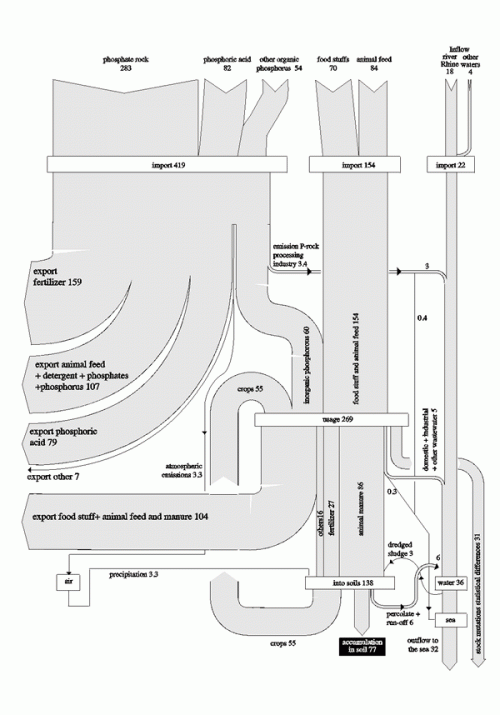
A recent visit to an organic farm and a chat with one of the staff on peak phosphorus made me search for Sankey diagrams on phophorus flows. Managed to find two, one of which is shown below. It is from an article ‘Phosphate recovery from animal manure the possibilities in the Netherlands’ by Van Ruiten Adviesbureau / Projectbureau BMA, for CEEP (November 1998) and shows phosphorus flows in the Netherlands in 1995 in million kg-P.
“It can be seen that 84 million kg P are imported in cattle feed alone (roughly 1/3 of the amount of P that is imported in phosphate ore). The excretion of phosphorus in animal manure is 86 million kg P according to the chart (about 197 million kg P2O5) … Moreover the figure shows that discharges of household and industrial waste water contain 10 million kg P. This is about 1/10 of the amount of P in animal manure.”
OK, this ia black/white retro style, but nevertheless a good Sankey diagram with flows to scale. Three vertical “columns” are for actual phosphorus imports: The largest quantity is direct imports (from phosphate rock, as phopshoric acid, and other organic phosphorous). The middle import column is for phosphorus embodied in food stuffs and animal feed. The third import pathway into the Netherlands is in waterways, such as the Rhine river, but this fraction remains unused. A large quantity of phosphorus is exported again (flows branching out to the left). 77 million kg-P per year accumulate in the soil. Another interesting detail is the flow labeled “stock mutations and statistical differences” branching out to the right.
Also see this post with a nitrogen flow Sankey diagrams from the Netherlands.
I will dig out the other phophorus Sankey and present it here in the near future…

1 Comment
Comments are closed.