Le Grand Est is a French administrative region in the north-east of the Hexagone, comprising Alsace, Champagne-Ardenne, and Lorraine. ATMO Grand Est is a not-for-profit, government-backed association that is monitoring air quality in the region and looking at ways to improve it.
As part of their work they have prepared energy flow diagrams, not only for the whole region, but also on the communal level. More than 100 Sankey diagrams, depicting the energy flows and the use of energy are available on the ATMO website. Visit the resources section and check “Diagrammes de Sankey” in the filter list at the right.
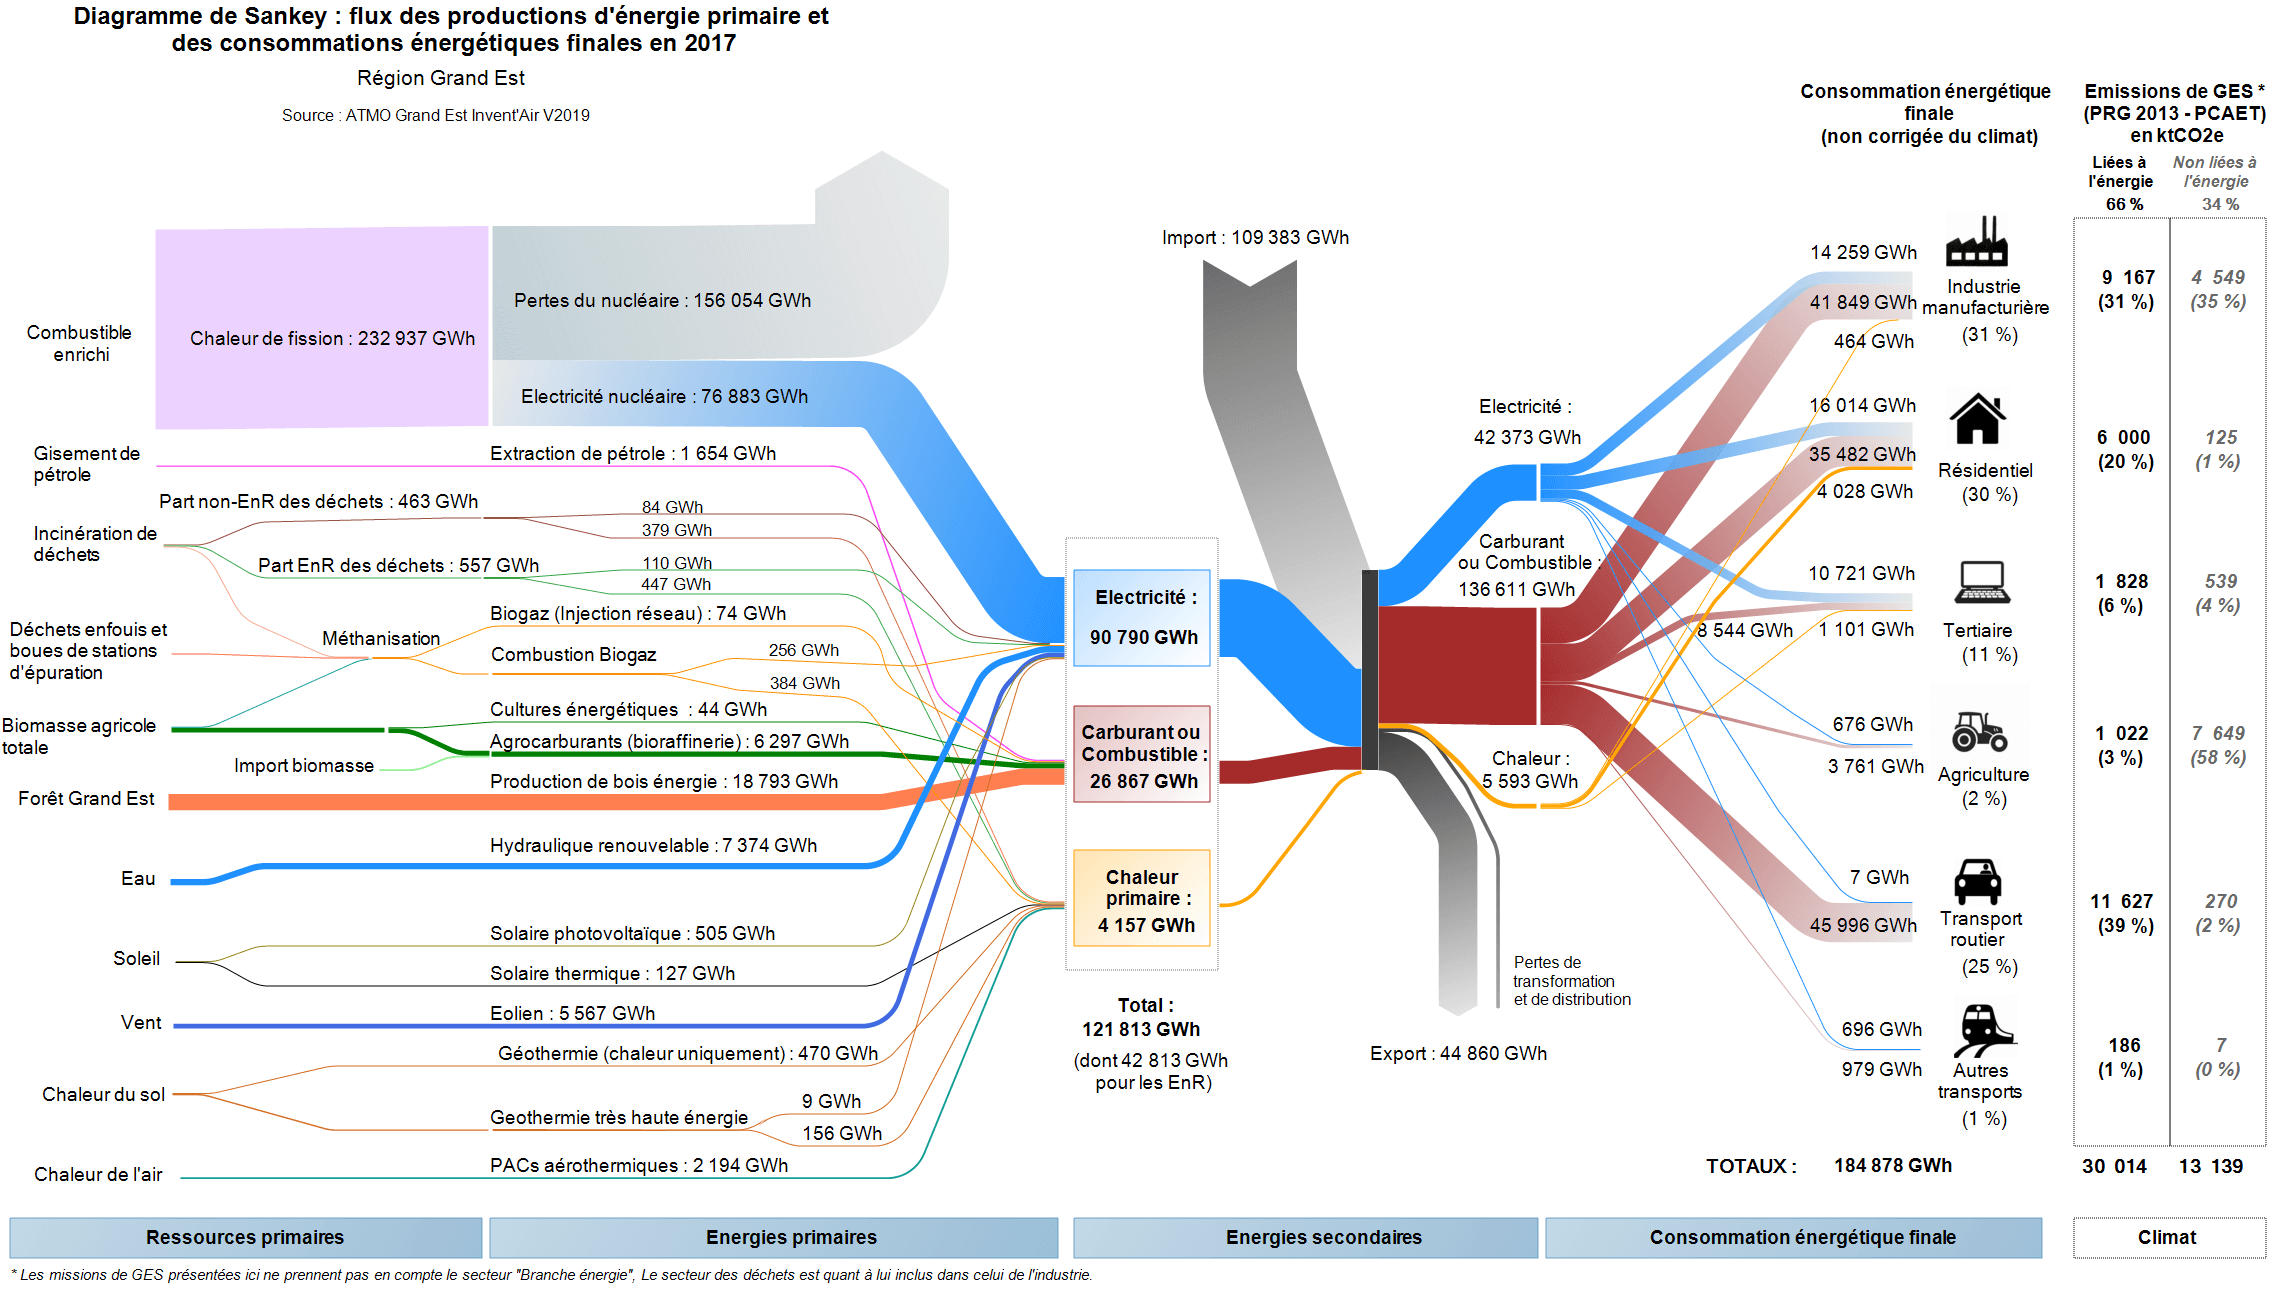
Here is the figure for the overall region with energy consumption and use in Grand Est in 2017. Flows are in GWh.
On the left we see primary resources, with the largest source being nuclear fuel. With an efficiency of only 33% this still delivers most of the secondary energy consumed in the Grand Est region. The grey stream from the top are “imports” to the region, most likely from other parts of France (or from neighboring Germany). The energy consuming sectors are shown on the right. A table next to them points out the GHG emissions linked to the energy.
Each of the individual Sankey diagrams for the CCs (communauté de communes, rural communities) and some CAs (communauté d’agglomération, semi-urban communities) available have exactly the same structure, but they can look strikingly different.
Here is one example from CC Portes de Meuse, a community with just over 17,000 inhabitants
CC Portes de Meuse can apparently cover three-quarters of their energy demand from wind and wood, with only 25% being imported. (Not sure though how they can have 260 GWh energy use in road transport, unless most vehicles are already electric).
Note that although both Sankey diagrams have a similar structure and flows are both in GWh in 2017, this diagram mustn’t be compared directly to the one above in regard to the width of the arrows, since they are on a different scale.
Great work by ATMO Grand Est, and I am sure these visualizations are useful when discussing energy consumption, GHG and air pollution among stakeholders in the communities or the region. They have already announced the Invent’AIR v2020 version to be published in the near future.
