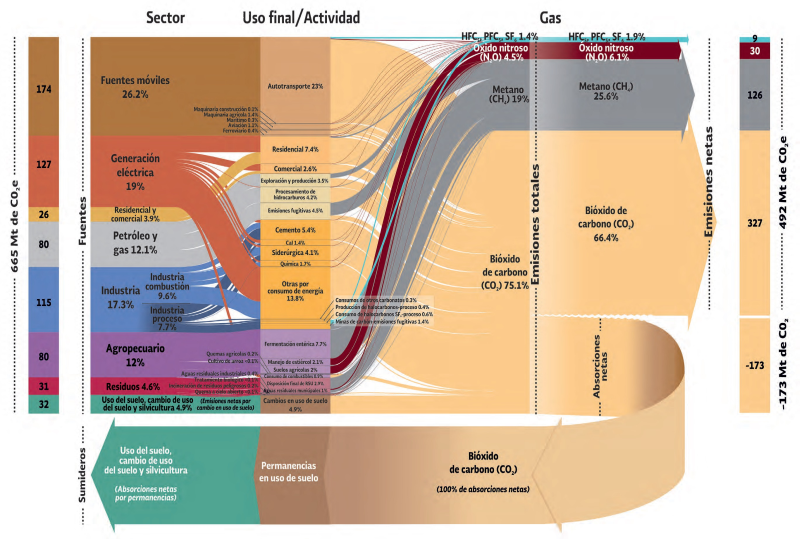
Here is a great Sankey diagram visualizing the greenhouse gas emissions of Mexico in 2015. This graphic comes from the ‘Sexta Comunicación Nacional y Segundo Informe Bienal de Actualización ante la Convención Marco de las Naciones Unidas sobre el Cambio Climático’ published by Secretaría de Medio Ambiente y Recursos Naturales (SEMARNAT) and Instituto Nacional de Ecología y Cambio Climático (INECC).
The Mexican national inventory of emissions of gases and composites withe greenhouse effect (Inventario Nacional de Emisiones de Gases y Compuestos de Efecto Invernadero) is compiled by INECC on a regular basis as part of its reporting as a signatory to the United Nations Framework Convention on Climate Change (UNFCCC). The report is here, you can find the graphic on pages 110/111.
On the left side we see the different sectors of the country and their contribution to the emission of the 665 Mt (megatonnes) of GHG gases in 2015. The unit of measure is Mt CO2 equivalents. For each of the sectors this is further broken down to the activities causing the emissions. Further to the right these emissions are split to the individual underlying gases,. We see a large share (75%) caused by carbon dioxide (bióxido de carbono), methane and nitrous oxides. 492 Mt CO2eq were released to the atmosphere, while 173 Mt CO2eq were sequestered (absorbed by plants and soil).
