The Australasian Institute of Mining and Metallurgy (AusIMM) is an association of the minerals industry. In this AusIMM Bulletin article titled ‘From Waste to Wealth’ they talk about metal recovery and recycling in Australia.
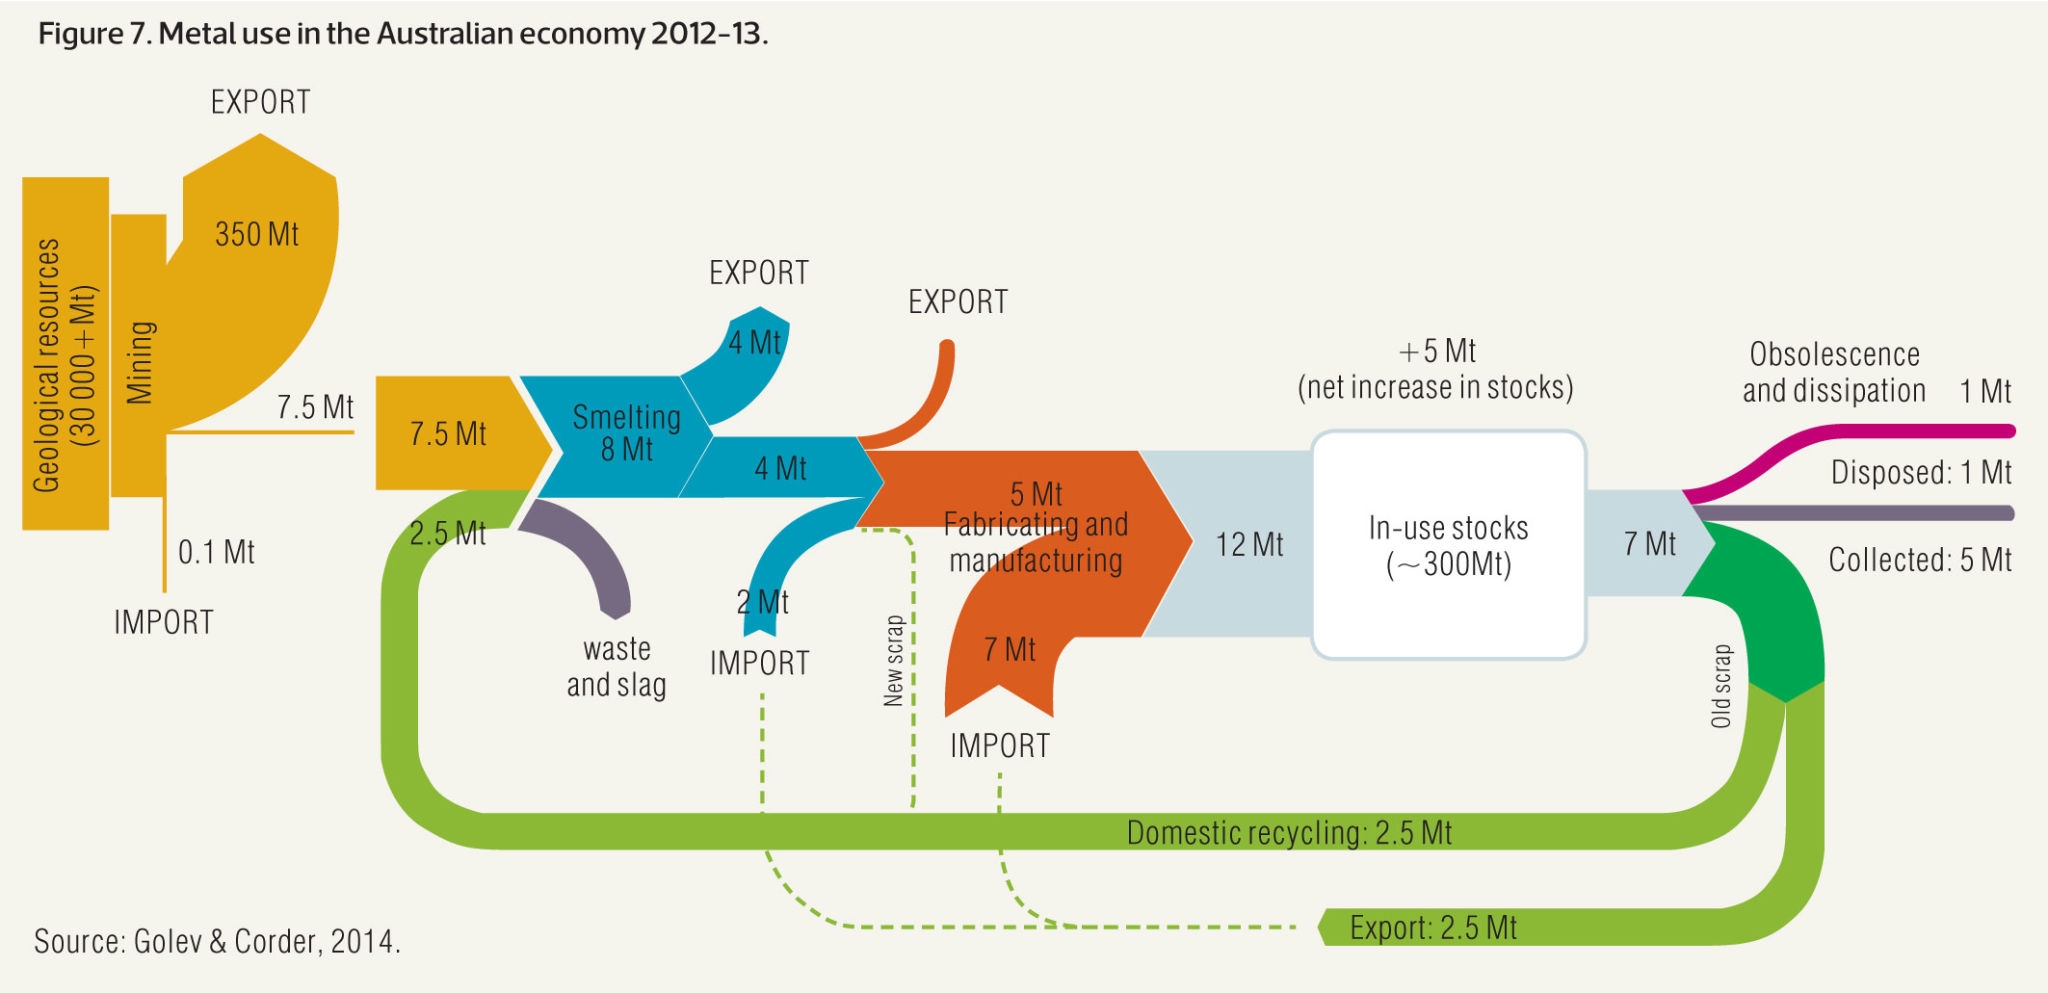
This Sankey diagram (actually two Sankey diagrams) from the article visualizes metal flows in Australia in 2012/2013 based on data from Golev & Corder (2014).
The smaller yellow diagram section on the left actually just shows mining activities in Australia and the fact that the largest portion of mining output (ores) are exported. Only 7.5 Mt are processed within Australia. This Sankey arrow is then blown up and corresponds to the yellow input stream into the second diagram [a similar solution to decouple diagrams with different scales was presented in yesterday’s post].
In the metal production process there are losses, and material is being exported and imported. The annual increase to the Australian ‘in use stocks’ (i.e. metals being used infrastructure, buildings and products) is 12 Mt, possible only thanks to 7 Mt metals imports. Some 7 Mt of metals are also released annually from ‘in use stocks’.
The dotted lines signal that there are possible routes, but either outside the scope of the Australian market or no reliable data is available (new scrap from the manufacturing step being fed back to the smelting).
