Tag: Australia

Circular Economy Roadmap Australia

CSIRO, Australia’s national science research agency, recently released a report “Circular economy roadmap for plastics, glass, paper and tyres. Pathways for unlocking future growth opportunities for Australia”. It looks at “a circular economy, with an objective of reducing total waste generated in Australia by 10 per cent per person by 2030”.

For each of the consumer products mentioned in the title it presents the current situation, and a 2030 circularity scenario as a Sankey diagram. Here is the one for plastics in Australia 2018 and 2030.

Flows are in million tonnes. In 2018 only 4% of plastics were recycled. This is projected to increase to 50% in a circular economy scenario, even with a slight overall increase in annual plastic use from 3.41 Mt to 3.76 Mt.

Read more here and download the summary report.

Australian Energy Flows 2012/2013

After posting on Australian Metals Flows yesterday I realized I had never presented a Sankey diagram for energy flows in Australia.

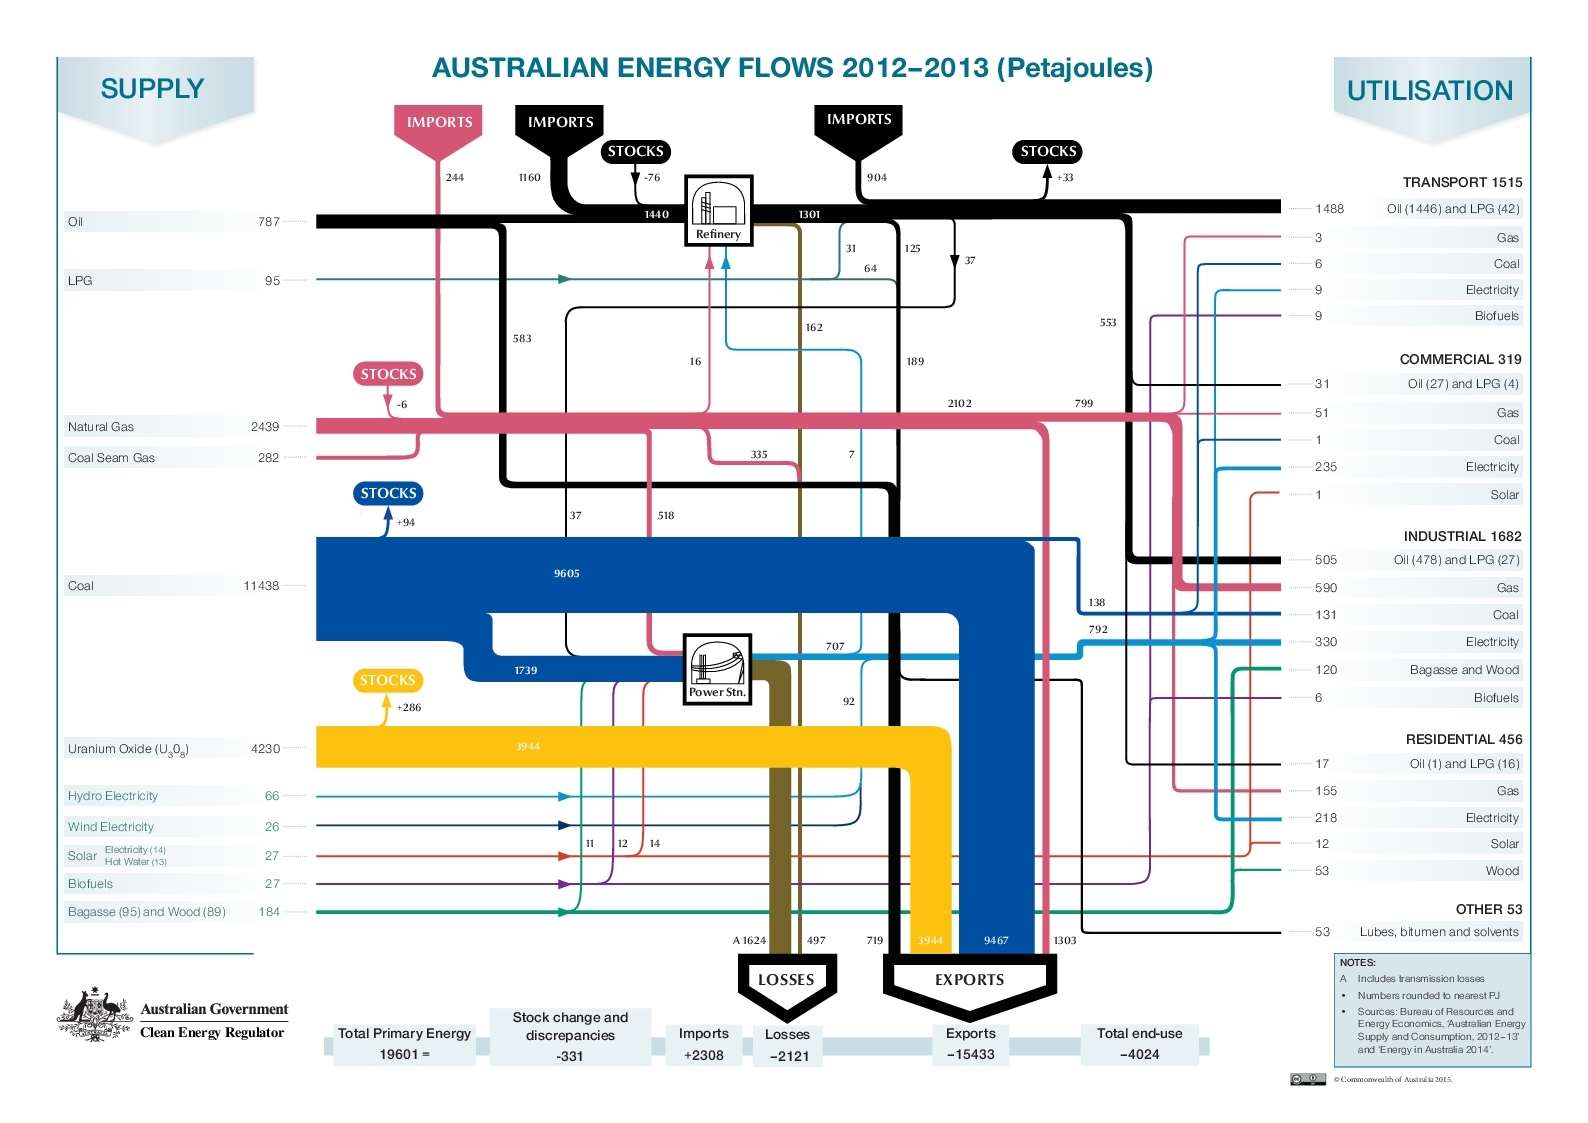
Well, here it is. From the Government of Australia, Clean Energy Regulator, Renewable Energy Target program website comes this beauty (CC-BY license Commonwealth of Australia):


One can really say that Australia is mainly exporting its energy. Flows in Petajoule (PJ) for the year 2012/13. Older energy flow diagrams available in the Australian Atlas of Minerals, Resources and Processing Centres here.

Australian Metal Flows

The Australasian Institute of Mining and Metallurgy (AusIMM) is an association of the minerals industry. In this AusIMM Bulletin article titled ‘From Waste to Wealth’ they talk about metal recovery and recycling in Australia.

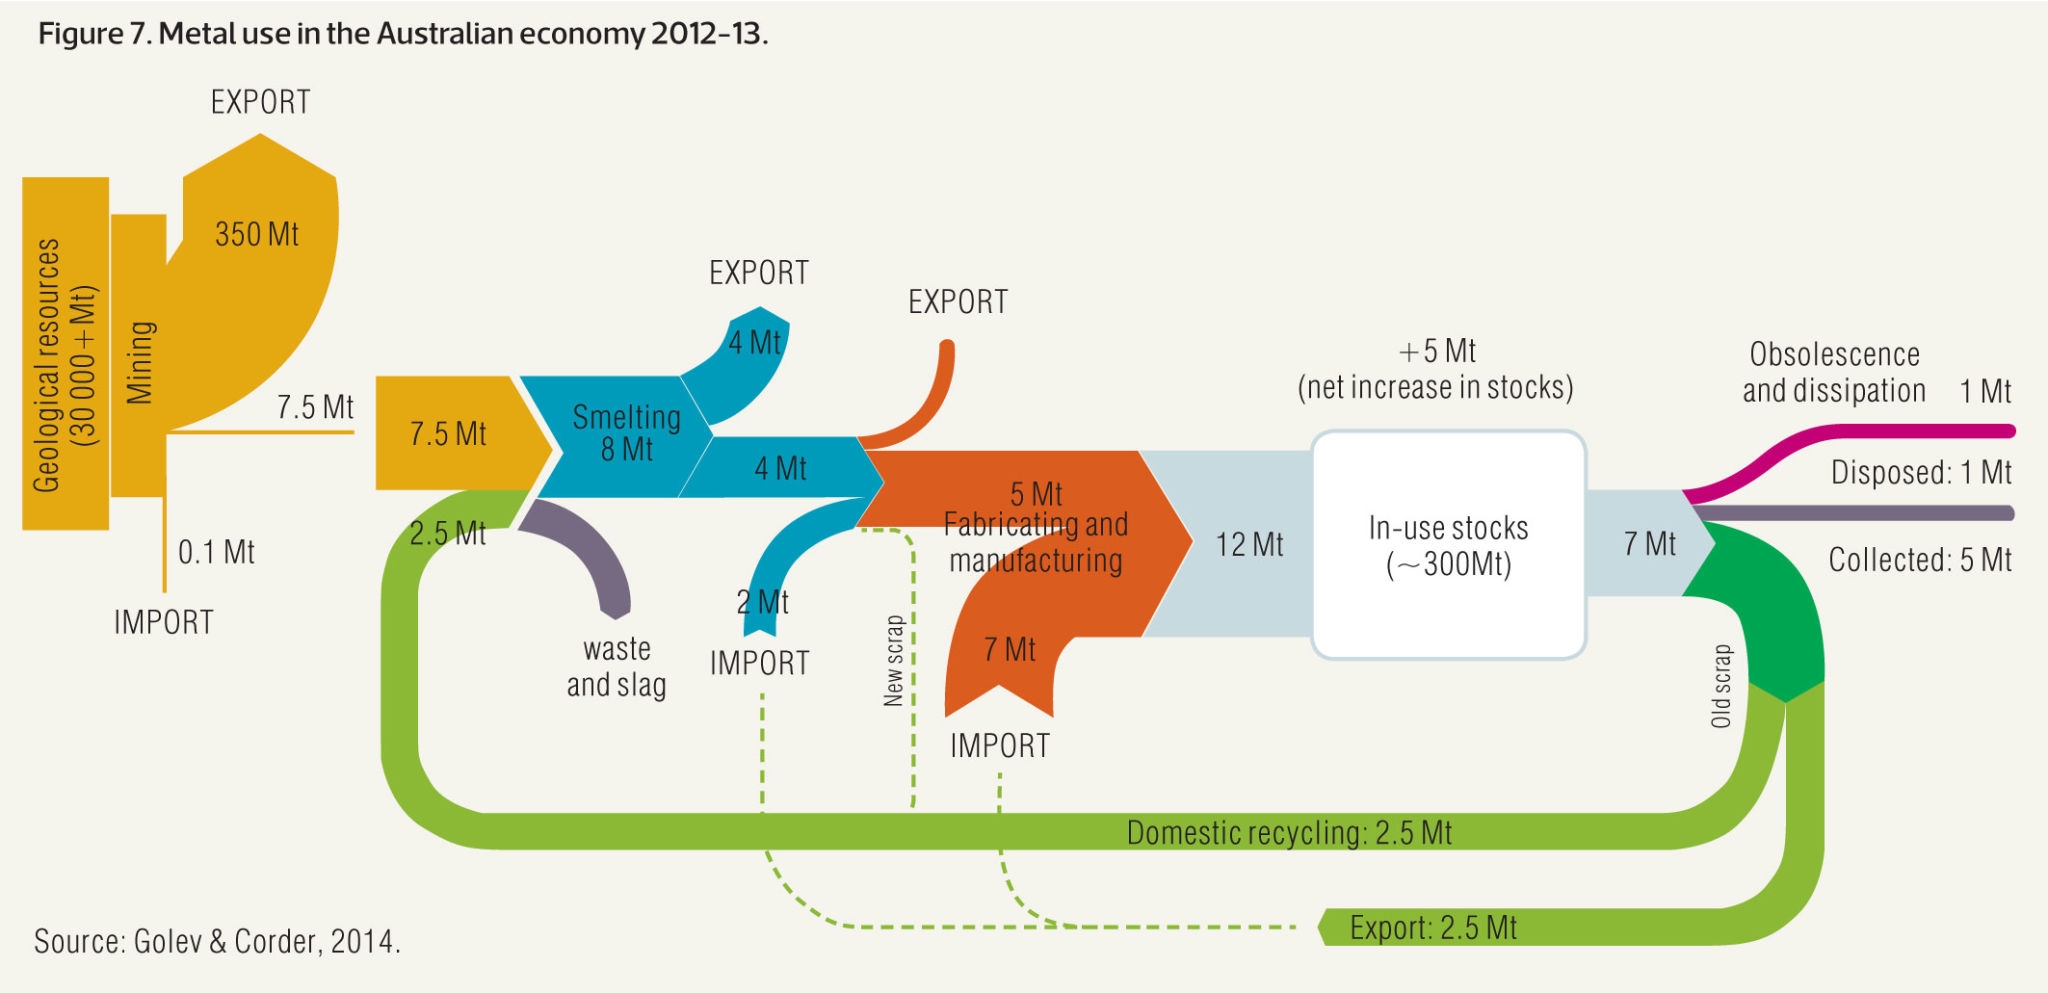
This Sankey diagram (actually two Sankey diagrams) from the article visualizes metal flows in Australia in 2012/2013 based on data from Golev & Corder (2014).

The smaller yellow diagram section on the left actually just shows mining activities in Australia and the fact that the largest portion of mining output (ores) are exported. Only 7.5 Mt are processed within Australia. This Sankey arrow is then blown up and corresponds to the yellow input stream into the second diagram [a similar solution to decouple diagrams with different scales was presented in yesterday’s post].

In the metal production process there are losses, and material is being exported and imported. The annual increase to the Australian ‘in use stocks’ (i.e. metals being used infrastructure, buildings and products) is 12 Mt, possible only thanks to 7 Mt metals imports. Some 7 Mt of metals are also released annually from ‘in use stocks’.

The dotted lines signal that there are possible routes, but either outside the scope of the Australian market or no reliable data is available (new scrap from the manufacturing step being fed back to the smelting).

Sankey for Energy Mass Balance

From a collection of case studies on Energy Efficiency found on the website of the Australian Department of Resources, Energy and Tourism (RET) comes the following Sankey diagram.

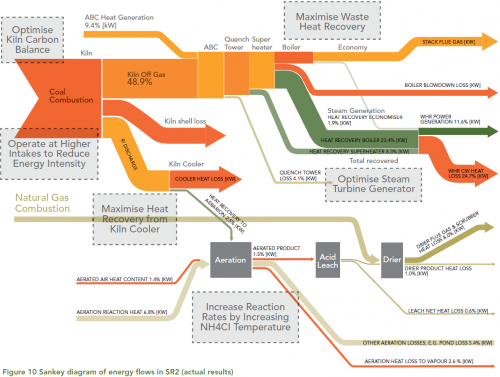
This is from a synthetic rutile plant of Iluka Resources Ltd. in Western Australia.

Iluka used the output from the energy and mass flows model to generate a Sankey diagram to represent the results in a visually effective and concise manner. The Sankey diagram illustrates where energy is supplied to the process, how it is transformed and where it leaves the process. … The width of the arrows is in proportion to the amount of energy associated with each part of the process. The Sankey diagram is an effective and intuitive way to communicate the energy flows at the plant. The diagram was used extensively during Iluka’s opportunity workshops. The diagram assisted the staff at the workshop to focus their attention on where the largest energy flows exist and identify where the main areas for improvement lie.

Flows are in percent of the energy input. Possible improvement measures are given in the grey boxes.

Full case study here (PDF).

Sankey diagrams @ visualign

The blog post I mentioned yesterday also has two fine examples of Sankey diagrams done with Mathematica. Nice colorful ones. Black background.

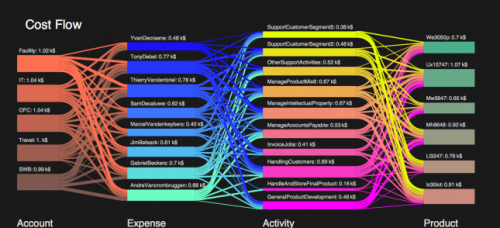
The first one is on cost flows and their distribution onto accounts, expenses, activities, and products (each represented by a column with nodes).

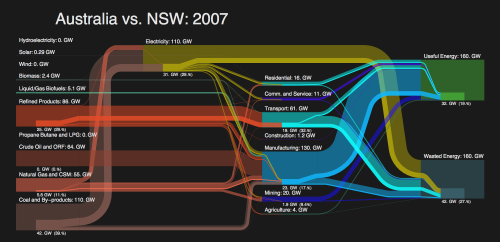
The other is by Sam Calisch (the author of the Mathematica workbook) and visualizes the efficiency of energy use in Australia.

Actually this second diagram is made up of two Sankey diagrams: the main one for Australia, the overlay one with the values for New South Wales. A cool idea to show the share of NSW.

The author of the post at visualign says that he “wouldn’t be surprised to see Sankey Diagrams make their way into modern data visualization tools such as Tableau or QlikView, perhaps even into Excel some day…”. This is of course an idea I like…

Making it look nicer…

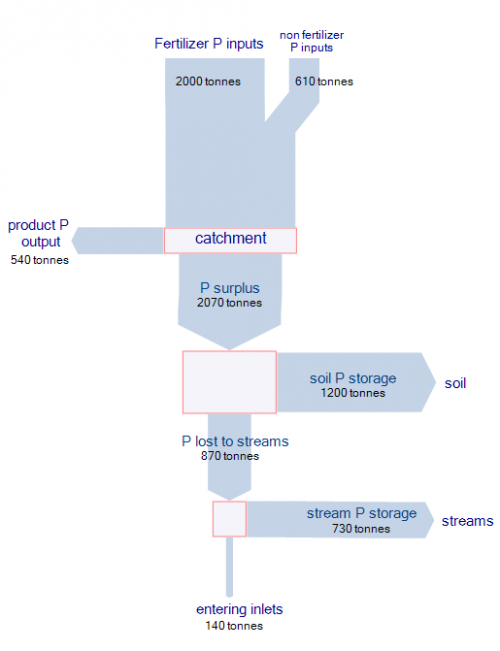
Reading on one of my favorite blogs actually made me take a harder stance on the Sankey diagram I presented in my last post. Following Kaiser’s attitude of making it better rather than only criticizing, I redesigned the Sankey diagram of phosphorus flows in the Peel-Harvey catchment area.

In the first version I didn’t differentiate the various sources of phosphorus, but only used one color for the overall flow quantity. Introducing nodes dramatically improves the comprehensibility and the mass balance check for the flows branching off sideways. There is some redundancy in the labeling of the flows, but I left it to stick as close to the original Sankey diagram as possible.

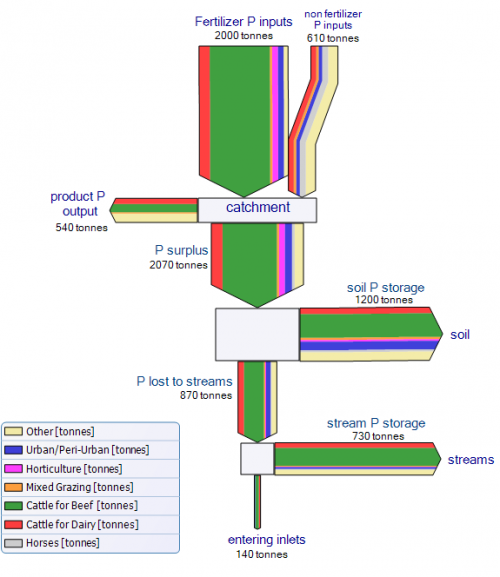
The second Sankey diagram is even closer to the original one. I tried to match the colors as much, and also introduced a legend. Please note that, since I didn’t have access to the raw data, I just approximated the flow values. Because of the multi flow arrows, I decided to leave a border line at each arrow, and to put heads to the first two input flows (‘fertiliser P input’ and ‘non fertiliser P input’) to better be able to distinguish them.

Sankey for Phosphorus Flows and their Origins

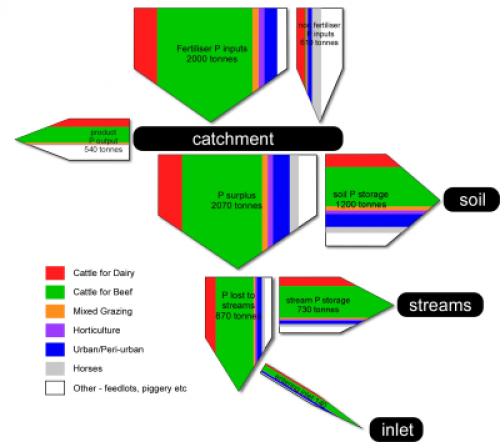
A paper on ‘Guiding BMP adoption to improve Water Quality in various Estuarine Ecosystems in Western Australia’ by Nardia Keipert from the University of Western Australia’s Department of Agriculture and Food shown on the ARWA Ecohydrology website features a Sankey diagram on phosphorus flow in a catchment area.

The stacked Sankey arrows show “the relative contribution from each land use sector”. The origins of the nutrients are cattle for dairy, cattle for beef, mixed grazing, horses, and others. From statistical data on nutrient use efficiency, which ranged from 10 to 50 %, the researchers estimated the accumulation of phosphorus in the soil and streams, and the final delivery into the ocean.

The Sankey diagram does look kind of … errh, how should I say, …. “different”. But this is mainly due to the fact that flows that accumulate in a storage branch off to the side. The arrow magnitudes are actually to scale. To check this, add the horizontal flow to the storage and the vertical flow.

The full report is here, the Sankey diagram is shown on page 8.

Update: see my followup post to this

Sankey Diagrams in Material Flow Accounting

Another field where Sankey diagrams are used widely is Material Flow Accounting, the analysis of material flows on a national or regional level. MFA focuses on bulk materials or individual substances (e.g. zinc, copper, cadmium) and the quantities in which they enter, leave or accumulate in a national economy.

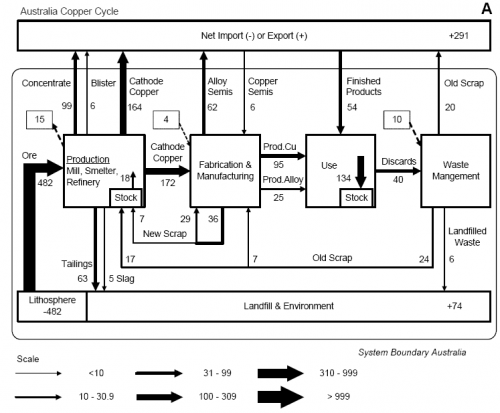
The diagram below is from a peer-reviewed paper presented at the 4th LCA conference in Australia (van Beers, van Berkel, Graedel: The Application of Material Flow Analysis for the Evaluation of the Recovery Potential of Secondary Metals in Australia, 2005). It shows the copper flows within the system boundary of Australia, the unit is Gg/year (= 1000 metric tons per year).

This “clustered” Sankey has six different flow widths, grouping together flow quantities within a specific range (e.g. <10, 10 < 30,9, …). Flows larger than 999 Gg/year are not shown any wider. This avoids that very large quantities “spoil” the whole diagram, as smaller flows become less significant in Sankey diagrams to scale.

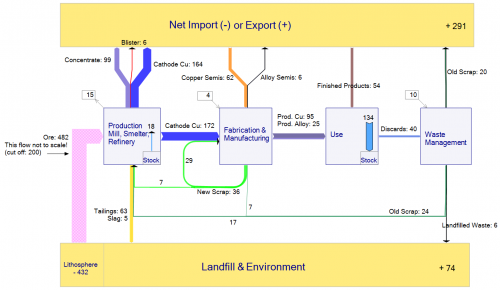
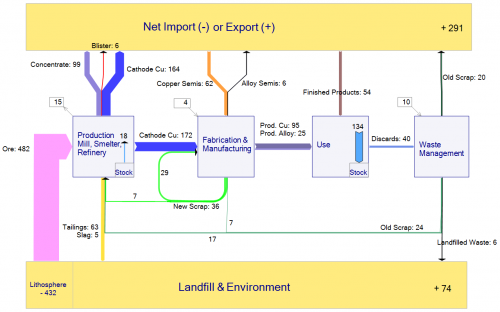
An alternative way to overcome the problem or very wide flows in a Sankey diagram spoiling the chart would be to define a cut-off quantity. Flows that are large than the cut-off quantity are excluded from the scale, and are shown with a hatch or moirée pattern. The two Sankey diagrams below were made based on the data from the above publication. The first one shows the large “Ore” flow with a cut-off level at 300 Gg/year (an additional note warns the reader that this flow is not to scale”, while the second diagram is fully to scale.


Very thin arrows additionally get explicit arrow heads to be able to identify their flow direction.

Feel free to comment