Category: Samples

Next stop … Sweden!

My Sankey diagram tour around the Baltic Sea continues. After stops in Estonia and Poland, today it is Sweden.

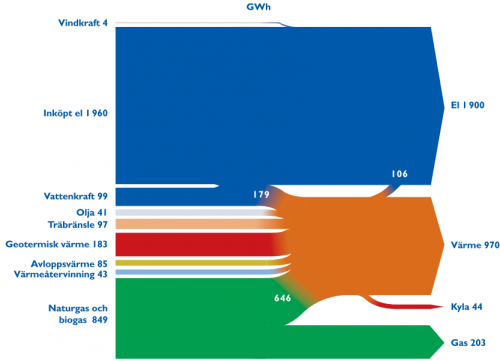
The diagram below is from the website of the energy provider of the Swedish city Lund.

This diagram is in GWh. It shows the different energy sources used in Lund on the left side, like wind energy (“Vindkraft”, 4 GWh) or geothermal energy (“Geotermisk värme”, 183 GWh). The largest portion (1960 GWh) is electrical energy purchased. The arrows on the right hand side show as what type the energy is being consumed: electricity, heat, cold and gas.

I like this diagram for its ‘blockish style” and the very strict horizontal orientation. The fact that certain flow quantities are branching off to join other arrows is indeed rather difficult to depict. You can see – especially on a b/w printout of the PDF file (on their old website) – that they were struggling with this, but they smoothed it nicely with color gradient effects.

If you take out your pocket calculator (and that’s what I always do!), you will come up with a difference of 244 GWh (“inputs” on the left 3361 GWh, “outputs” on the right 3117 GWh). Might this be attributed to transformation losses?
A nice one from Poland

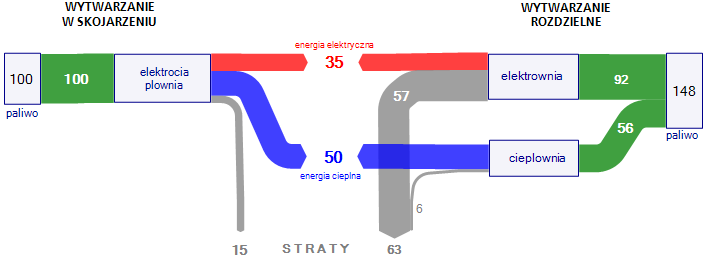
On my quest for more interesting Sankey diagrams I stumbled across a wykres Sankeya on a web page from Poland, which I reproduced here using ifu’s e!Sankey tool.

It shows the advantage of energy cogeneration plants over energy production in separate plants. From a base value of 100 a yield of 85% can be reached in cogeneration plants (35% electric energy, 50% heat energy – the original text accompanying the diagram says 30% electric energy, 55% heat energy) with 15% losses. To get the same energy amount from separate energy generation plants, the required energy feedstock is 1.48 times higher, with losses more than four times higher (63:15), especially originating from the generation of electricity.

While I am far from fostering one or the other technology with this post, I think this Sankey diagram merits special attention, because it is actually a 2-in-1 diagram (both with flow direction left-to-middle and right-to middle) and a baseline scenario comparison. A very nice idea!

Lying with Sankey diagrams (1)

I have decided to present in a loose sequence some diagrams I have found on the web that are obviously wrong. Or -let’s put it in other words- don’t reflect the numbers appropriately. Well, we all know that this happens quite often, and if you plan to do that purposely this book might be of use for you…

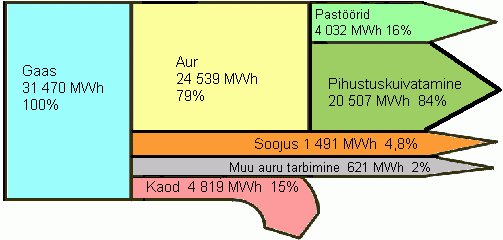
So, here is the first sample from an Estonian energy portal page:

I kind of like this Sankey diagram, because it is simple, colorful, and even though I don’t speak Eesti, I more or less get the meaning of it.

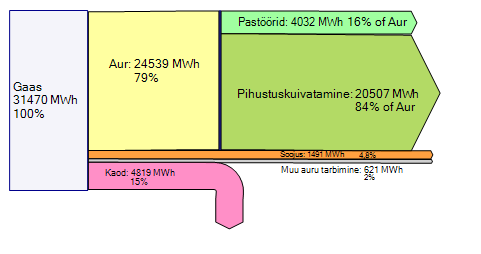
However, have a look at the gray flow labeled “Muu auru tarbimine” which supposedly represents 2% of the overall energy. Shouldn’t it be much thinner, compared to the other flows? I think this ‘not-to-scale’ representation is owed to the fact that in a diagram set up with a conventional drawing tool (is it Power Point they used?) would be very hard to draw and the label couldn’t be placed inside. So they decided to make it “small” but at the same time “lying” with this diagram.

It is also quite funky how the purple arrow for “Kaod” has an arrow line pretty much to scale, but the arrow head is much fatter!
Ah well, and the percentage values don’t add up to 100% and the percentage values for the green flows (“Pasöörid” and “Pihustuskuivatamine” – I love that word!) are percentiles of the yellow “Aur” flow in contrast to the other percent indications.

Here is the same Sankey diagram but with the values to scale, automatically created with a Sankey diagram software. I have adjusted the percentiles in accordance with the absolute values given.

Do you have an interesting Sankey diagram to share? Send it to phineas@sankey-diagrams.com

Greenhouse Gas Emissions in the U.S.

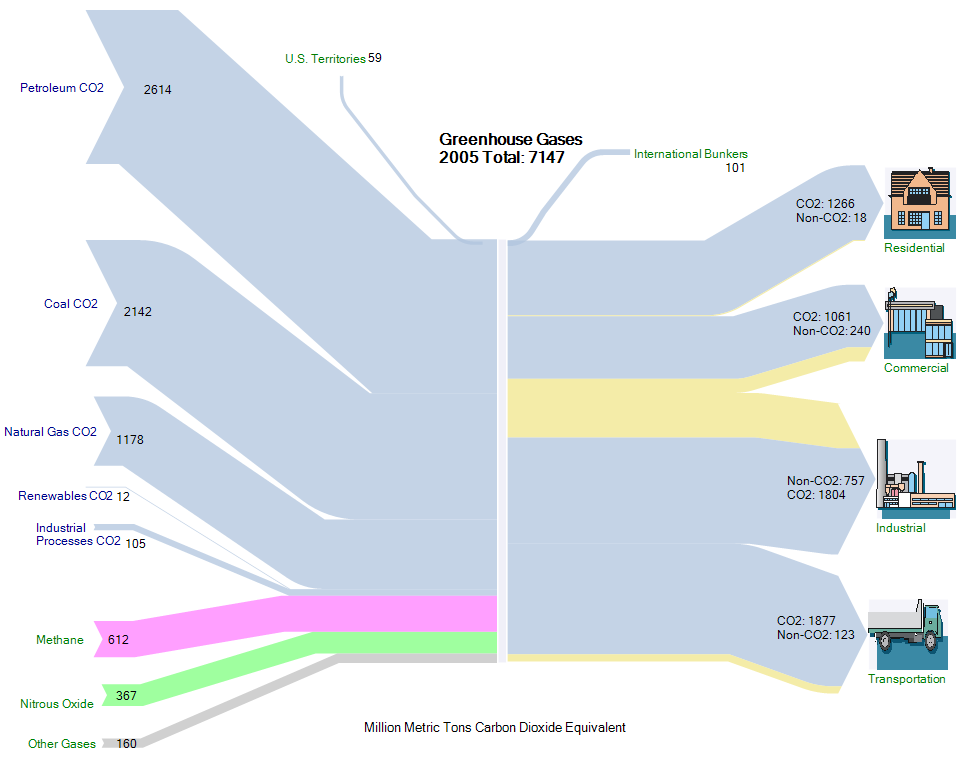
The Energy Information Administration (EIA) of the U.S. Department of Energy (DOE) publishes an annual report on the Greenhouse Gas Emissions in the US economy. The executive summary of the 2005 report shows a Sankey diagram on page xv.

This Sankey diagram shows on the left side the different sources of CO2 (mainly combustibles), and on the right hand side the industrial sectors (residential, commercial, industrial and transport) that contribute to the CO2 release. Emissions are in million ton CO2-equivalents.

The original Sankey diagram from the report has been reproduced with the e!Sankey software, and is shown below. Footnotes have been omitted, for full detail please refer to the original source.

Tracing Substances in Material Flow Systems

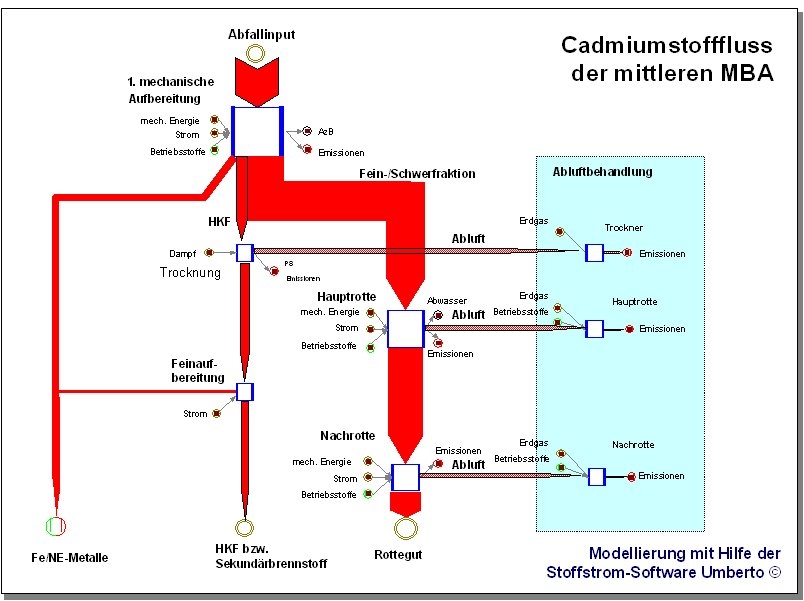
One important issue in material flow models is tracing of certain substances, such as heavy metals or toxins. While the overall material flow quantity is less relevant, the focus is on comparatively smaller quantities.

The Sankey diagram below shows the Cadmium (Cd) flows in an composting plant (mechanic-biological treatment plant, MBT). It was created by ifeu Institute in Heidelberg with the material flow management software Umberto.

In the modeling software Umberto, the Sankey diagrams are an optional way of displaying calculated material flows.

Energy Losses in Industrial Ceramic Furnace

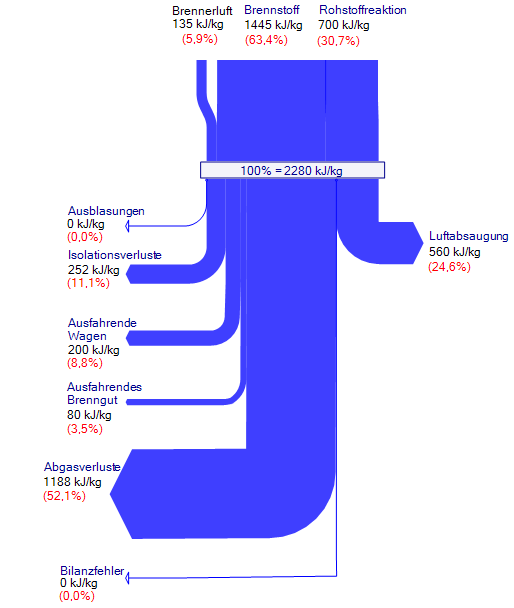
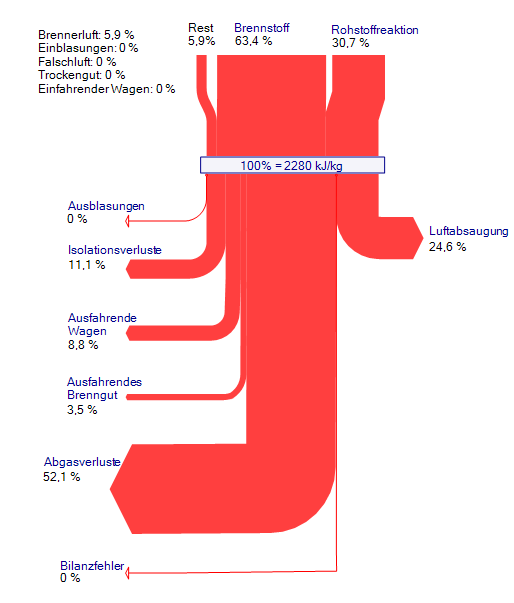
Here are two Sankey diagrams that show the energy losses in an industrial ceramic furnace. The diagrams are oriented top-down. The labels are in German.

The Sankey diagram in blue shows the energy use in an industrial ceramic furnace. The flows are shown in absolute values and in percentage values.

The second diagram in red is similar to the blue one, but it only show the relative flows in percentiles. Additionally the flows entering the diagram at the top have been separated to show their shares. Other flows (‘Rest’) have been grouped together and the individual contributions are shown on the label.

Energy Balance for Stoves in Indian Silk Industry

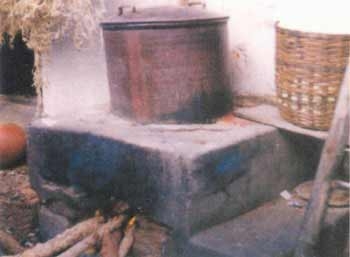
This article on the FAO website shows a comparison of several types of simples stoves and their energy balance using Sankey diagrams.

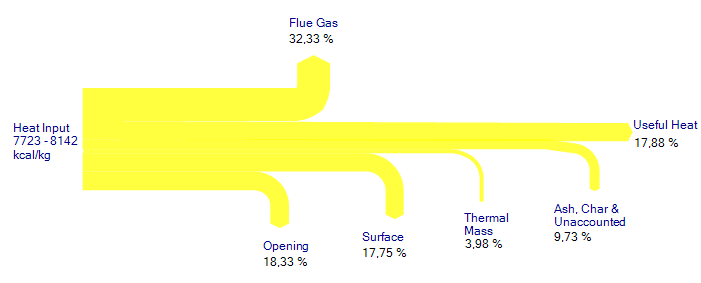
The Sankey diagrams show how the energy (typically from wood firing) is lost, and that only a small fraction of 12 to 20 % is actually being used as “useful heat”.

More of these “heat flow diagrams” can be found in chapter 4.2. of the article.

A rather special feature of the diagrams shown in this article is that the percentile values given for the flows cover a range (e.g. Ash and Char 5,97% – 12,15%), rather than a specific absolute value. This is rather untypical. Also, it can be noted, that the width of the arrows are not always to scale: compare, for example, the width of the “Surface” arrrow to that of the “Thermal Mass” arrow. It should be roughly four times wider.

The same Sankey diagram created with a Sankey software tool shows the arrow widths correctly.