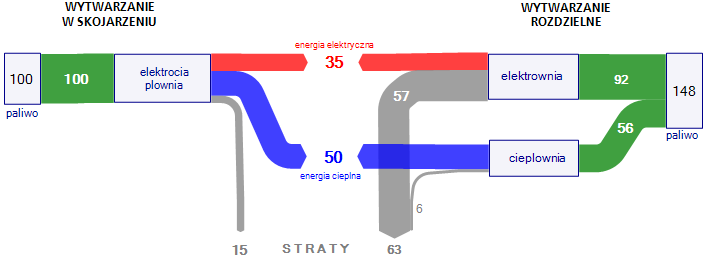
On my quest for more interesting Sankey diagrams I stumbled across a wykres Sankeya on a web page from Poland, which I reproduced here using ifu’s e!Sankey tool.
It shows the advantage of energy cogeneration plants over energy production in separate plants. From a base value of 100 a yield of 85% can be reached in cogeneration plants (35% electric energy, 50% heat energy – the original text accompanying the diagram says 30% electric energy, 55% heat energy) with 15% losses. To get the same energy amount from separate energy generation plants, the required energy feedstock is 1.48 times higher, with losses more than four times higher (63:15), especially originating from the generation of electricity.
While I am far from fostering one or the other technology with this post, I think this Sankey diagram merits special attention, because it is actually a 2-in-1 diagram (both with flow direction left-to-middle and right-to middle) and a baseline scenario comparison. A very nice idea!

2 Comments
A very similar Sankey diagram for combined heat and power (CHP) can be found in this article on the Sustainable Energy Ireland (SEI) webpage
Comments are closed.