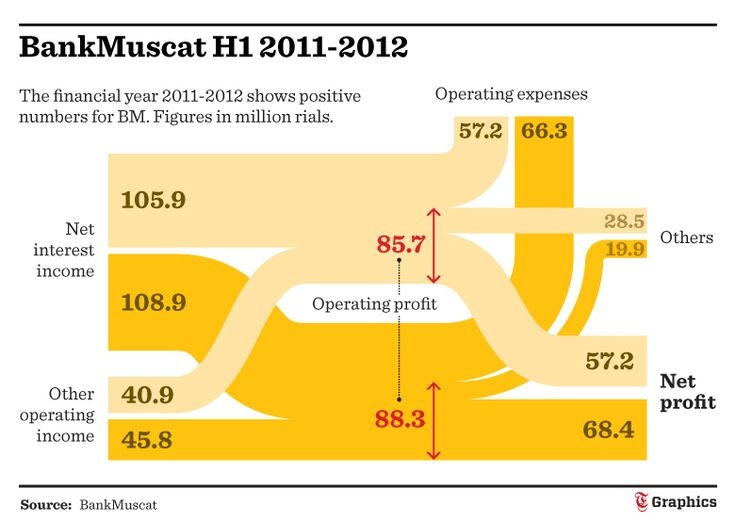
This Sankey diagram can be considered a distribution diagram as it shows how net interest income and other operating income of Bank Muscat in 2011/2012 are split into operating expenses and net profit.
(Source: Times of Oman Graphics)
Only at second sight I found out that this is actually a year-on-year comparison of the figures for H1/2011 and H1/2012. The light yellow flows are for the previous year, the dark orange flows for the other year, indicating an operating profit increase of 2.6 Mio Rials.
