This article on ‘A Pilot for Measuring Energy Retrofits’ describes how researchers from the EEB Hub used an old navy building in Philadalphia to “determine detailed system performance”.
EEB Hub researchers outfitted Building 101 with sensors and a data acquisition system to determine detailed system performance, building energy loads, indoor environmental quality (IEQ), and a detailed operation of the building control system. … The sensors read data from 509 sensing points, collecting 1,048 pieces of data at one-minute intervals. These data points track indoor air quality, occupant comfort, and building energy use.
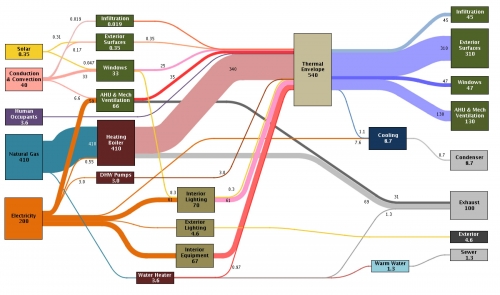
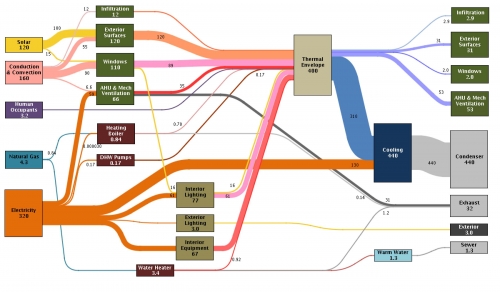
The result of that “inverse modelling” (i.e. measuring) approach are presented in Sankey diagrams and are used “to identify discrepancies in the predicted versus actual energy balance”.
There are significant differences between the January energy use…
… and the energy picture in July
While in winter mainly natural gas is used for heating, the gas consumption in summer is down. In July electricity consumption is significantly higher due to air conditioning.
Unfortunately no unit of measurement is given (it could be kWh), but nevertheless proportions of the energy flows are correct.

