Tag: energy balance

LatAm BEN – Bolivia

In my mini-series on National Energy Balances (Balance Energético Nacional, BEN) of countries in South and Central America, I have reached the Plurinational State of Bolivia.

I couldn’t find any Sankey diagrams on the website of the Ministerio de Hidrocarburos, which apparently is responsible for drawing up the energy balances for Bolivia. However, I was sure they must exist, as a press release for the launch event of the report exists. Finally I found a publication of the ministry for 2000-2009 in the BIVICA library and it has some black/white energy flow diagrams.

There have been newer editions of the report until at least 2015, and here is the BEN Bolivia for 2014 (from the OLADE library), You might remember that OLADE, the inter-governmental Organización Latinoamericana de Energía plays an important role in motivating countries to draw up their BEN and runs a website where BENs are available for many Latin American countries).


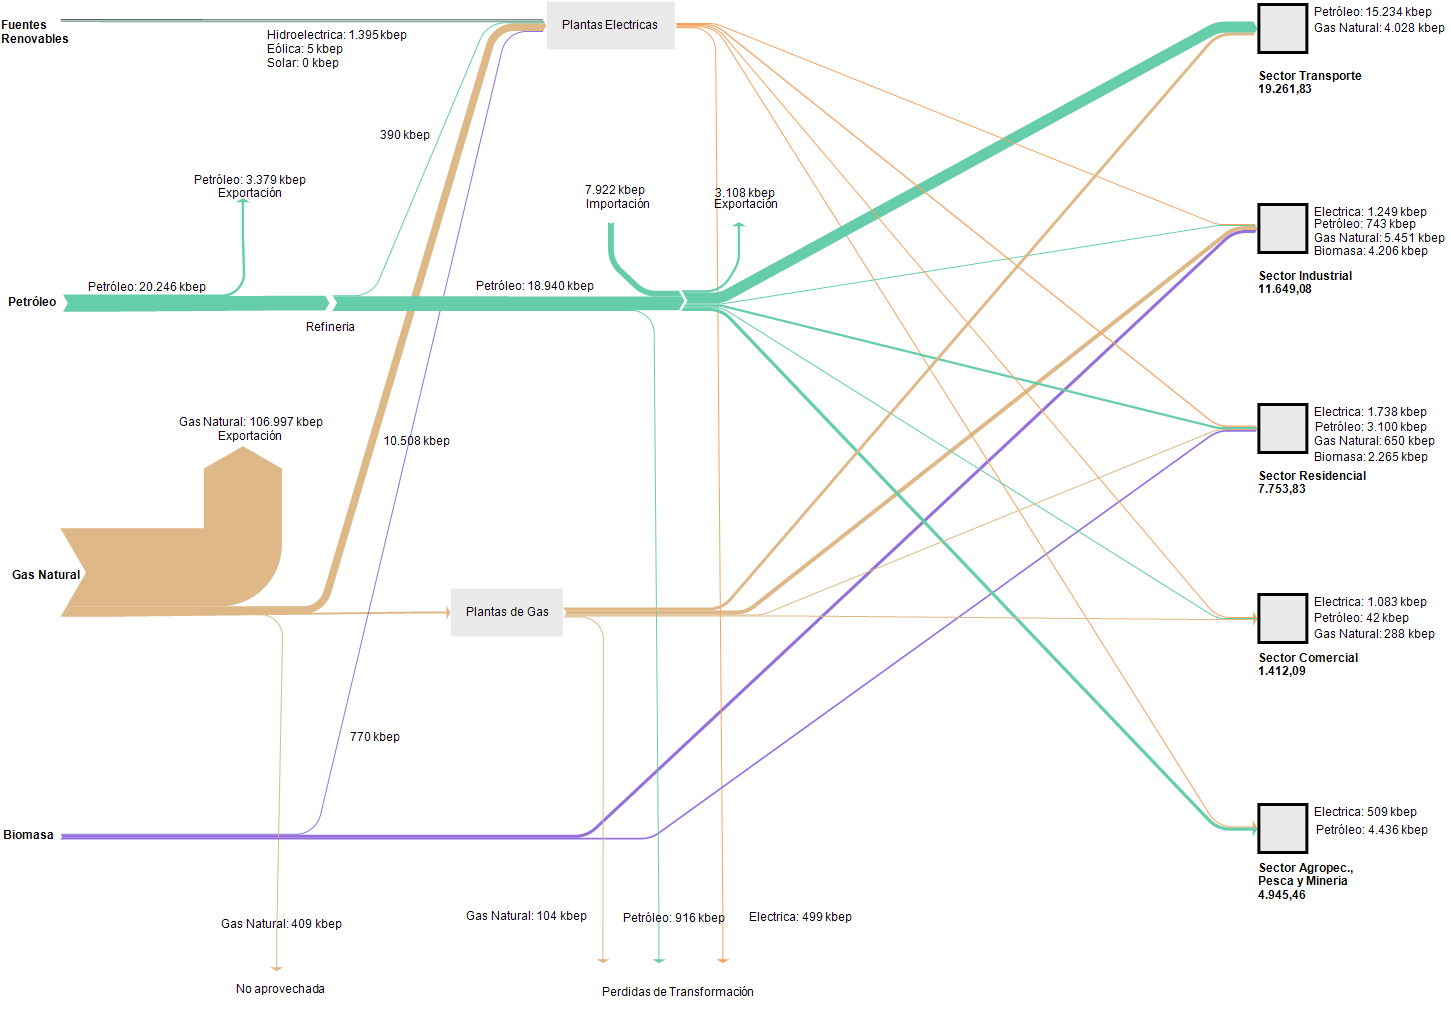
The unit of flows is ‘kbep’ (kilo barrels of oil equivalents / miles de barriles equivalentes de petróleo). Now, this Sankey diagram is definitely not to scale: the width of the flow representing 133,902 kbep of gas would have to be almost 6 times wider than the one standing for 23,065 kbep of petroleum. The biomass flow would have to be much thinner in comparison, hence it is over emphasized in the diagram for the reader who is unaware. My feeling is that the person who did this wasn’t acting with bad intentions, but had no technical means or support to do this properly and just glued it together from round rectangles, arrows and other shapes.

Definitely a candidate for a remake, if I find the time… Edit: I found some time to remake this BEN for Bolivia with flows being to scale. Quite a difference to the above! It becomes obvious, that the country is primarily a natural gas exporter. I didn’t notice this dominance of energy export at first. Now with the flows being to scale, the details and differences of the other flows are hard to tell. One would have to remove the natural gas export to show more of the domestic energy flows.

An analysis of the BEN Bolivia and some background on the data is available (in Spanish) in this paper.
LatAm BEN – Brazil

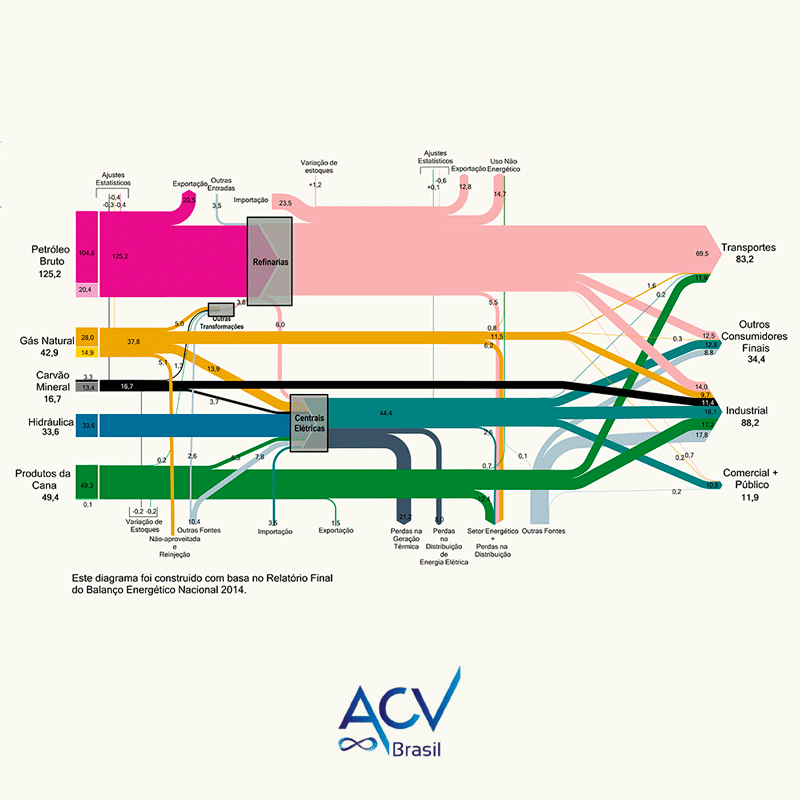
Working my way up the southern cone, here is the Balanço Energético Nacional 2014 for Brazil. Found this on the webpage of Curitiba based consulting firm ACV Brasil.

The national energy balances for Brazil are published annually by the Ministério de Minas e Energia (MME), and newer reports are available (PDF for 2018, large!). However, the energy flows diagrams in these official reports are less refined, so I opted to go with the remake by ACV.


The unit of flow is not shown, but my guess is that it is Mtep. like in the original publication.

LatAm BEN – Paraguay

So, after Argentina and Uruguay, here is the Balance Energético Nacional (BEN) for Paraguay.

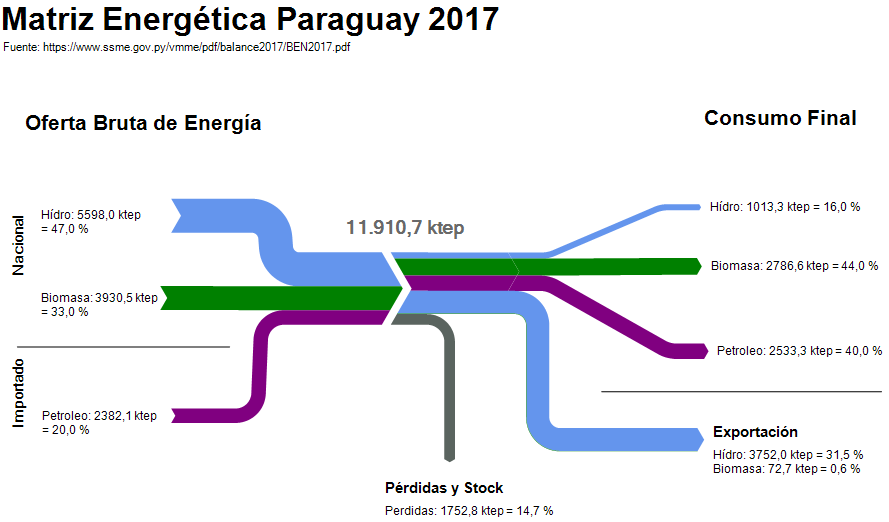
I couldn’t find any Sankey diagram for the national energy flows on any government website. However, a document on the Balance Energético Nacional (BEN) is published annually by the Viceministério de Minas y Energía. It contains this schematic drawing:

I turned this into a Sankey diagram using the ktep values and the percentage shares indicated.


The structure of this BEN is a little different from the ones previously seen, since it doesn’t indicate the sectors of final consumption. Obviously, most imported crude derivates are used for transport. Regarding biomass, the report indicates that wood is used in households for cooking and sugar cane to produce ethanol to be mixed into fuels for the transport sector. Electricity is produced entirely from hydropower and Paraguay exports over half of the electricity generated to its neighbours Argentina and Brasil.

LatAm BEN – Uruguay

Working my way up the southern cone, next in the mini-series on national energy balances for countries in Latin America is the one for Argentina‘s neighbor: Uruguay.

The Ministerio de Industria, Energía y Minería (MIEM) is publishing the Balance Energetico Nacional (BEN) for Uruguay and there is a dedicated website with all the underlying data.


The flow diagram (diagrama de flujo) for the 2015 energy balance was produced by engineering and energy consultancy SEG Ingenieria from Montevideo and appeared in their technical file on energy indicators (Nov 2016, in Spanish only).

Flows are in ktoe (Spanish: ktep, kilo tonelada equivalente de petróleo). The country-wide final consumption in 2015 was 4399 ktoe.

The round icons visualize sources, energy conversion and consuming sectors. They look nice and playful, however, they might also dissimulate the flow quantities: For example, if you look at ‘Transporte’ and ‘Industria’ in the right-hand side, they do have the same diameter, but transport has a 28% share of the final consumption while industry has 42%.

LatAm BEN – Argentina

Recently I have been reading about energy policies in Latin American countries. Quito-based OLADE, the inter-governmental Organización Latinoamericana de Energía plays a key role in coordination and cooperation between countries in regard to energy.

OLADE has also established the SIER (Sistema de Información Energética Regional), and one of their products is SieLAC (Sistema de Información Energética de Latinoamérica Latina y el Caribe) where energy data for 27 countries can be accessed.

For all countries the national energy balance (Balance Energético Nacional, BEN) can be produced as Sankey diagrams for the years 2005 through to 2010. Further, these energy flows can also be shown for regions, such as the Caribbean, the Andean countries or the “Southern Cone”.

Here is the one for Argentina in 2010.

To try for yourself, just go to the sieLAC page and click on ‘Balance Energético Resumido’. Then select country, year and the unit.
Unfortunately, data for more recent years is not available at this time.

This work of OLADE has inspired me to start a loose mini-series of posts titled ‘LatAm BEN’ where I will be showing Sankey diagrams representing national energy balances from the region. Don’t worry, they will not all be from SieLAC, and will show how differently BENs can look like.

What’s in a Book? Sankey Diagrams!

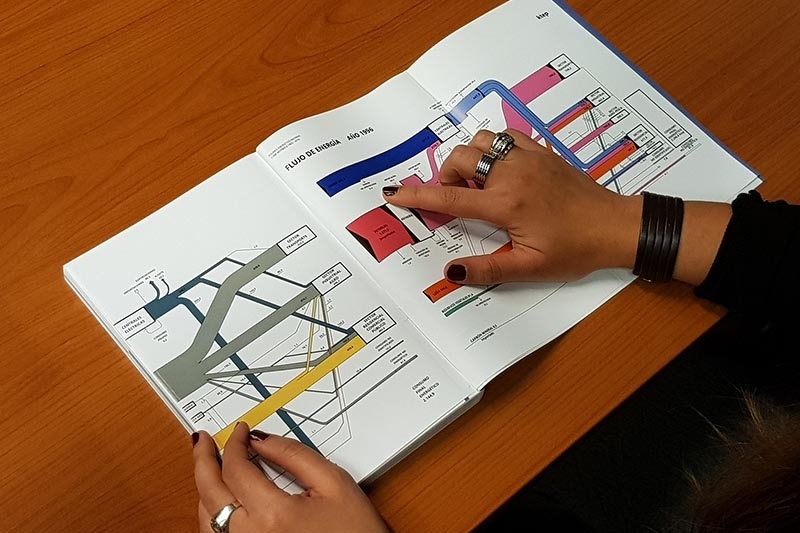
I would love to get a copy of the book shown in the picture below… but then it is probably just a symbolic photo of someone studying the energy balance of a country (the caption reads “Energy Flows Year 1996”).


This find has inspired me to a new mini-series of posts on national energy balances shown as Sankey diagrams with a focus on Latin America.

Here is the list with links to all post so far:
Argentina: 2010
Bolivia: 2014
Brazil: 2014
Chile: 2015
Colombia: 2012
Costa Rica: 2010, 2015
Ecuador: 2017
Guatemala: 2011
Honduras: 2017
Mexico: 2011 and 2016 (coming up)
Panama: 2018
Paraguay: 2017
Peru: 2009, 2017
Uruguay: 2015

Update 04/2020: I am still looking for energy balances for a number of Central American countries (Nicaragua, El Salvador) and for Venezuela on the southern cone. If you can point me to some sources, please leave a comment below.

Denmark Energy Flows

Denmark’s Energy Flows for the year 2016 were published by Danish Energy Agency (‘Energistyrelsen’).

For detail, I recommend to study the high-quality image of the Sankey diagam in this PDF.

Flows are in petajoule (PJ). Smaller flows are shown with a minimum width, so they are not to scale with the others, but remain visible. Even zero flows are shown, either because there is actually a quantity (less than 1 PJ) that is just rounded, or, because in other years there might be a flow quantity available for them. Arrows arrive at the nodes separately, their flow labels shown inside the node. This feature enhances legibility quite a bit.

Also see this 2012 post on a Denmark 2050 Nuclear Free Energy Scenario.

Botswana Energy Flows

Botswana, a country with just over 2 million population, borders South Africa to the North. Would you be able to tell its capital?

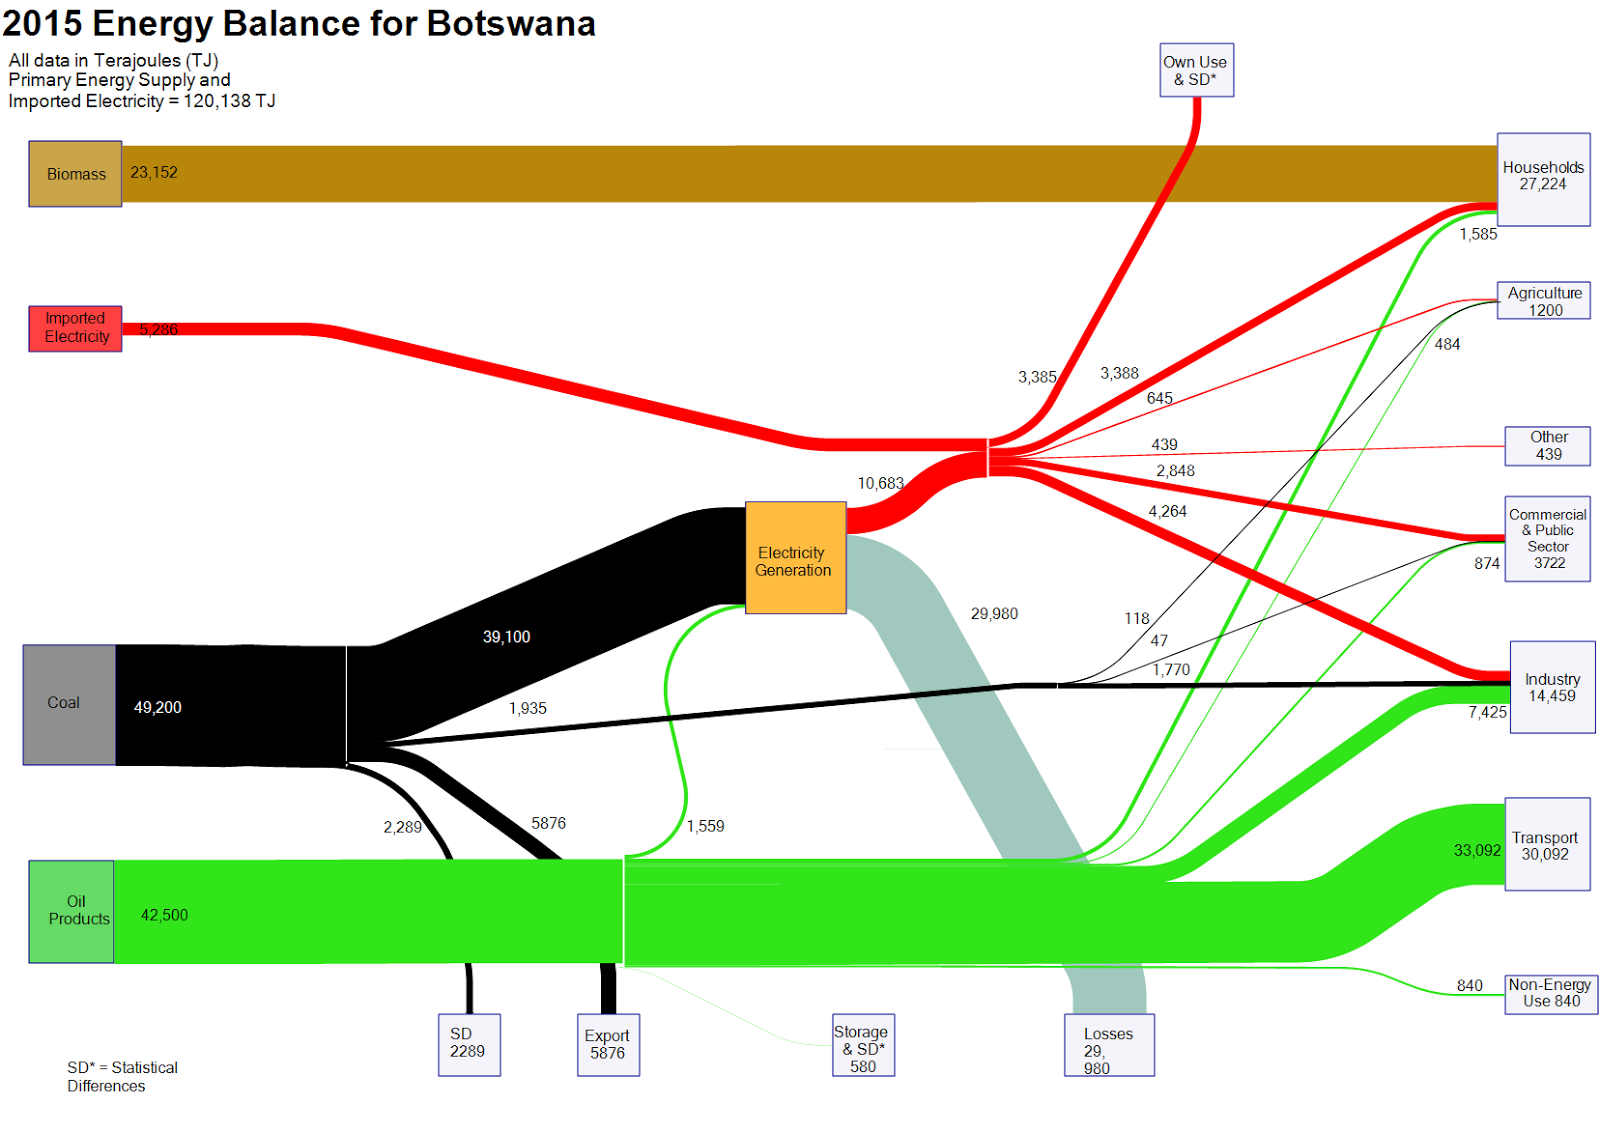
Nevertheless, a Sankey diagram with the energy balance of Botswana can be found on the web. Mike Mooiman, a professor at Franklin Pierce University, New Hampshire and a former visiting scholar at University of Botswana featured it on his ‘Energy in Botswana’ blog. These are the energy flows for the African country for 2015 (based on IEA data).


Flows are in terajoule (TJ) and overall energy demand was 120,138 TJ. Biomass (wood) is the predominant fuel in private households (e.g. for cooking). Locally mined coal accounts for 40% of the primary energy and is used for electricity generation with an efficiency factor of below 30%. Imported oil products account for over 40% of the energy consumed (mainly for transportation).

The 2012 energy balance for Botswana is also available on Mike’s blog.