Month: December 2009

The Beauty of Sankey Diagrams

End-of-year cleanup of my bookmarks and saved diagrams. There are more goodies, and enough in stock for a couple of posts next year…

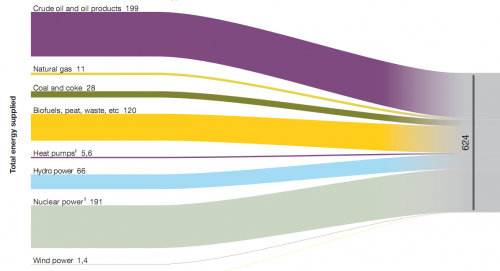
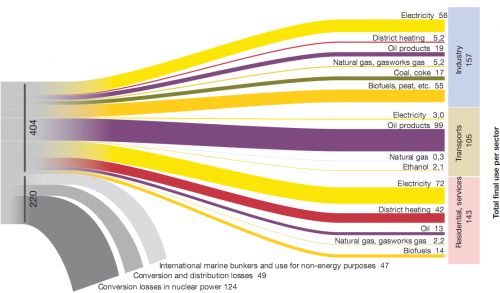
Below are three image sections of a Sankey diagram showing Swedish energy flows in 2007. These were published on p. 54/55 in the report ‘Energy in Sweden 2008’ by Swedish Energy Agency (Energimyndigheten). Numbers are in TWh, source for the diagram was Statistics Sweden data.

The first diagram (which is the left part of the diagram) shows the total 624 TWh energy supplied and the energy sources. The second one is the breakdown of energy produced by sectors, and also shows the losses in energy conversion. The third on is a different breakdown of the 404 TWh by energy carrier.

Nothing more to add. They are simple, clean, beautiful.

West Virginia Energy Flow Sankey

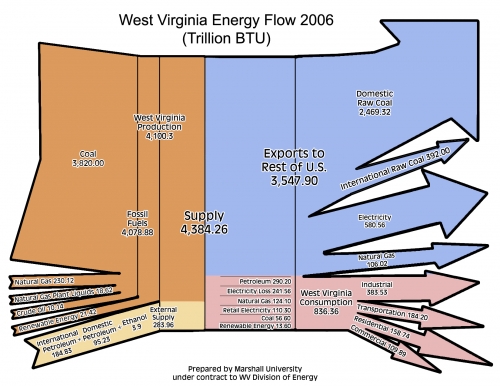
The Mountain State saw the annual Governor’s Energy Summit in Roanoke on Dec 9, 2009. West Virginia relies heavily on coal, and is a net energy exporter to other U.S. states.

The energy flow Sankey diagram below (created by Marshall University for WV Energy Division) was presented at last year’s energy summit, and is available along with the other presentations here.

Figures are for 2006 in trillion BTU. Energy carriers used in WV are displayed as flows entering from the left. Domestic energy sources are in orange, while imported supplies are in sand color. Overall energy in 2006 was 4,384 trillion BTU. The state exported 81% of the energy (blue) and consumed 19% within (836 trillion BTU). A breakdown of doemstic consumption by sectors is shown in pink.

This Sankey diagram looks nice, but violates the basic rule for Sankey diagrams: flows have to be to scale among each other. The magnitude of the stacked orange arrows (representing 4100 trillion BTU West Virginia production) should be 14.5 times larger than that of the sand color flow (representing 283.86 trillion BTU), however it is only about 9 times larger, overemphasizing external supply (or underrepresenting domestic energy supply).

Or, compare the two arrows fro “crude oil” (10.14) and “natural gas” (230.12). The latter should have 23 times the width of the other… The blue arrow for “international raw coal” (392) looks approximately as wide as that of the blue “natural gas” (106). The scale might still be somehow OK for the base of the arrow, but as the arrow becomes thinner towards the head, the 4:1 ratio is definitely not supported any more.
Metropolitan Energy Flow Sankey Diagrams

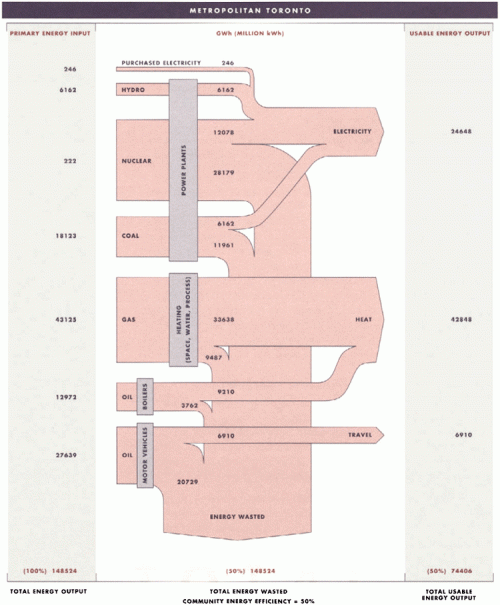
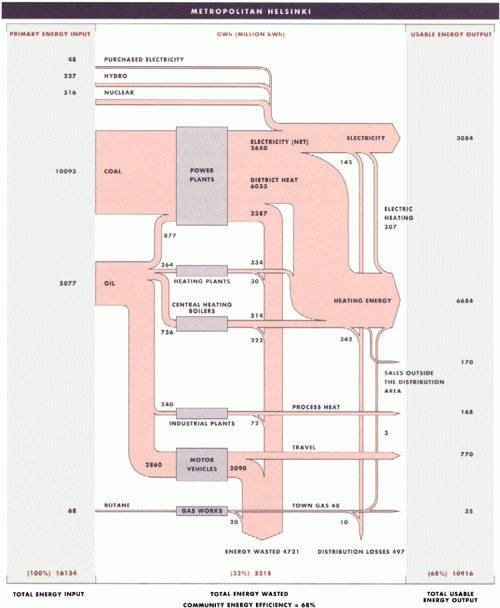
I have posted several Sankey diagrams depicting the energy flows of countries. At least California and West Virginia have published state energy flow Sankey diagrams. I was quite excited to discover the two metropolitan energy flow Sankey diagrams shown below in this publication. They are for Toronto and Helsinki and show energy flows in 1988 in these communities.

The two diagrams show energy consumption and use in Toronto (above) and Helsinki (below). Even though the absolute figures in GWh are given, one shouldn’t directly compare them. A per capita basis would be fairer (Toronto had a population of 2.5 mio in 2006, more than 5 mio. in the metro area, while Helsinki had 580.000 inhabitants in 2008 in the city, 1.3 mio in the greater Helsinki area — Toronto is today 4.5 times larger than Helsinki). Both are “cold-climate municipalities”.

The publication calculates a ‘community energy efficiency’ of 50% for Toronto and 68% for Helsinki. “A comparison of the two municipalities reveals that Helsinki significantly improved its efficiency by using the waste heat that is produced by local coal power plants to warm 90% of the buildings and homes in Helsinki. Further analysis has demonstrated that Helsinki’s energy system was able to achieve its overall level of 68% efficiency because the city’s compact land-use pattern made investments in energy-saving infrastructure, such as district heating and public transit, economically viable.”

Does anybody know other metropolitan energy flow studies? I am aware of research activities in the field of urban material flow accounts or urban metabolism (e.g. Lisbon) but have to check whether they show Sankey diagrams in their publications.