Month: June 2011

Energy Flow Charts UK 2009

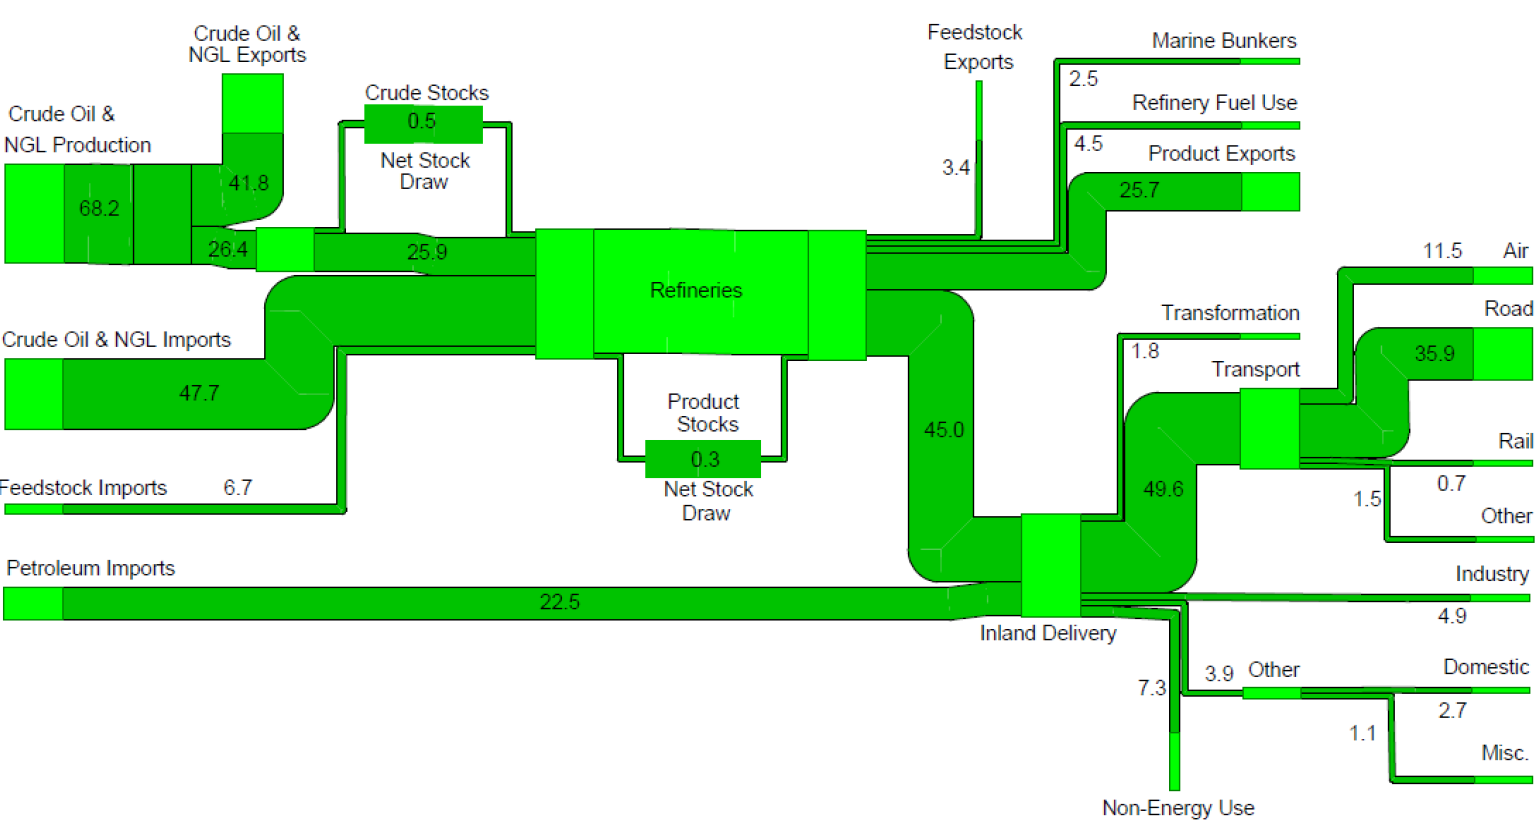
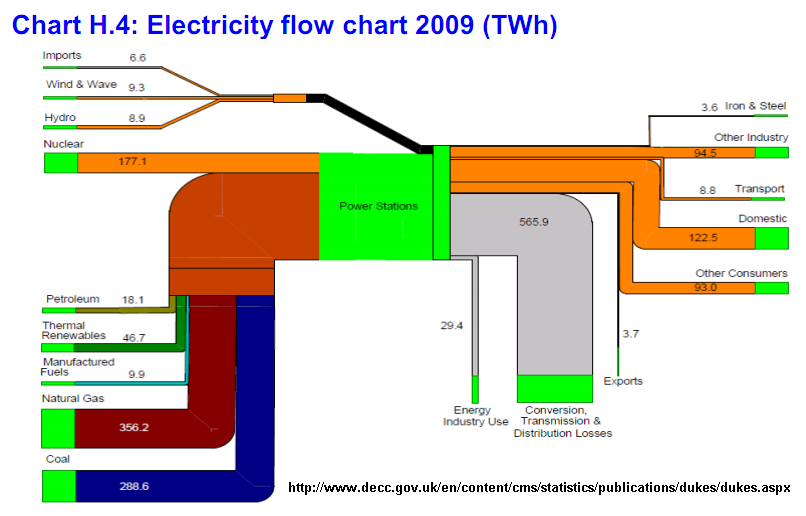
Featured on Jo Abbess’ blog on ‘Energy Change for Climate Control’ recently was this Sankey diagram. It appears in his recent post on ‘The Waste of Power’. It was originally published in Annex H of the 2009 Digest of United Kingdom Energy Statistics (DUKES) published by Department of Energy and Climate Change (DECC).

The report has numerous other Sankey diagrams like this one, similarly structured. They show energy use of coal, petroleum, natural gas, and renewables.

Below is the one on petroleum flows in 2009 in millio tons. A lower threshold has been introduced, so that small quantities don’t fall below a minimum width (see, for example, the flow of 0.7 mio tons to “Rail”, compared to the one of 4.9 mio tons to “Industry”, which would in principal be 7 times wider if it was to scale.

Nice and colorful!
Molly Eagan’s 100 Days Without Oil

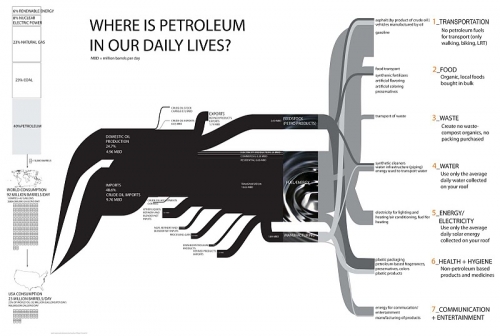
Molly Eagan’s ambitious project ‘100 Days Without Oil’ got some attention in the blogosphere, and even from traditional media. Molly’s dedication to living one hundred days without oil fascinated me, but by putting up the below Sankey diagram on her blog she fully convinced me …

Molly is an Architecture/Sustainable Design graduate student at the University of Minnesota. From August 15 to November 22, 2010 she tried to live a fully-no-oil life style.

By using myself as a research tool I can easily document all aspects of my life and how they might be affected in this not-to-distant world. I’ll be tracking my life in seven categories: Transportation, Food, Waste, Water, Electricity, Health/Hygiene, and Communication/Entertainment.

Her self-set rules were quite strict, and I personally think that the water use part is the hardest constraint. Read more about the criteria of this experiment.

The Sankey diagram is based on data from the Energy Information Administration Annual Energy Review 2008, but has been expanded on the right side with examples for the seven categories she identified for her project.

New version of e!Sankey

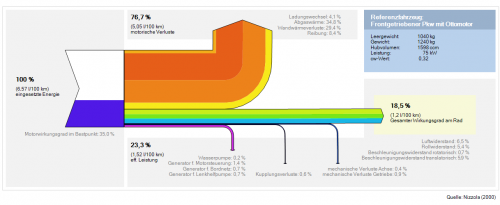
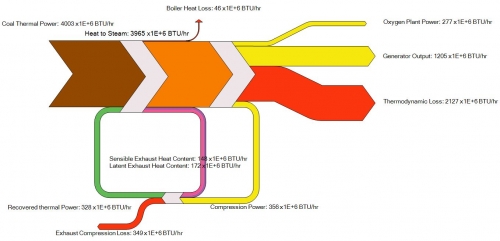
A new version of e!Sankey has been released recently. e!Sankey 3.0 comes with a series of new features, such as reconnecting arrows to another node, alignment of elements, definition of unit types, or the long awaited multiple element edit. According to their forum they have also implemented a number of features suggested by the e!Sankey user community.

The below are two new samples shipped with the test version. The first is for the efficiency of a car engine, in German…


… the second a remake of the oxy-combustion Sankey diagram I presented here on the blog two years ago:

The price has gone up a little for the new version. I have updated my Sankey software page accordingly.