Month: February 2012

Yet another Sankey map overlay

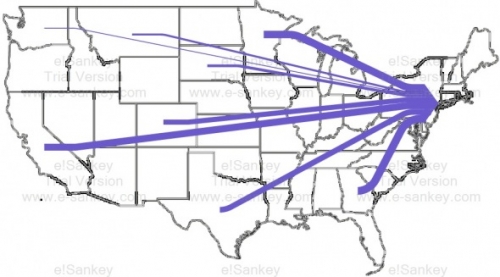
John Cochran blogs about his coursework at University of Virgina. His project on ‘Urban Metabolisms’ has this Sankey diagram of food being transported to New York City. Data is from The Federal Highway Administration (USDOT) Freight Analysis Framework.

The first Sankey diagram shows transports to New York (excluding the Northeastern States and transports within NY). The food supplied by other US states becomes relatively insignificant:


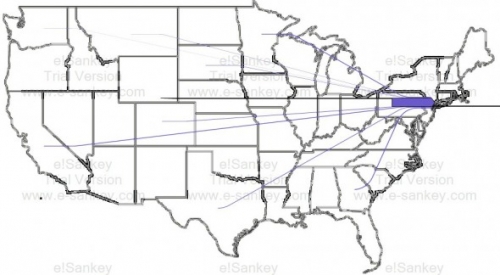
The second one includes food transports within NY state (still excluding the Northeastern States):


John, however has not been satisified with the results of his work. He writes (scroll down to his September 21, 2011 notes):

“Neither produced effective graphics, but what they did demonstrate was the inability of the information to be able to represent food going to New York. (…) As a result, the data “revealed” that we already have a very local food system, when in reality this is not the case; instead, it does indicate how many extra miles are traveled for food around the location of purchase. (…) The images below demonstrate just how disproportionate the amount of miles traveled in New York are to the miles traveled bring food to New York from the rest of the country.”

It remains unclear whether the flows displayed in the diagram are for payload (e.g tonnes of food) or payload distance (e.g. tonne-kilometres). Also, it is not mentioned, whether, for example, water and drinks (typically sourced locally) are included.

I think the idea of thie Sankey map overlay is great, but the issue of spatial representation of (dense) data points has not been adequately adressed. A zoomed NY state would maybe help.
Block Type Sankey Diagram

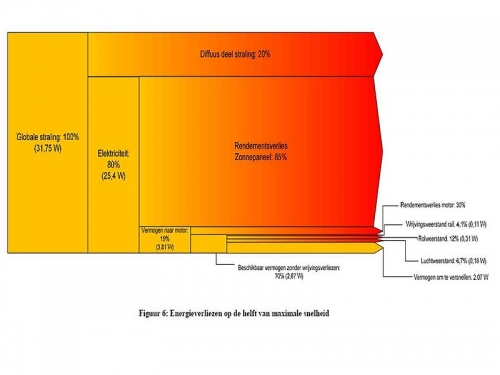
Another Sankey diagram type I have come across several times are the very compact ‘block-type’ Sankey diagrams. They basically consist of stacked rectangles, like in the below example from Wikiversity dealing with a solar vehicle project. A left-to-right flow orientation is indicated by the arrow heads peeking out of the stack on the right side.


The diagram shows a breakdown or use of the 100% (31.75W) of solar energy (‘globale straling’). The percentage values always refer to the previous block. This one also has a nice color gradient.

Cool! Cyclifier 3D Sankey Diagram on Food

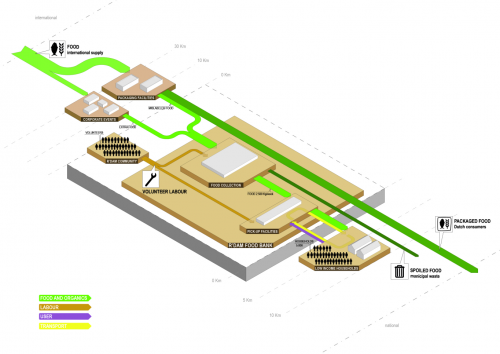
Found on cyclifier.org, a project run by Dutch 2012Architecten: This 3D Sankey diagram by Anna Brambilla visualizes flows of food from producers to the Rotterdam foodbank and onto low income households.


Source: http://www.cyclifier.org/project/foodbank (License: Share-Alike)

The image is explained as follows:

“Processes and actors are identified by labeled platforms with sub-processes shown as stacked platforms. The system boundary is shown as an extruded block indicating that it is one piece within a larger network. Starting from the edges of the cyclifier, distances are marked in intervals to indicate the distances traveled by inputs and outputs. Flows are scaled by mass as in sankey diagrams and are color-coded per flow type. Flows to and from the atmosphere are represented as traveling vertically.”

So, we have ‘Food and Organics’ flows (green), transport (yellow), users (purple) and even volunteer labor (brown) represented in the diagram. No numbers or units given though. Since cyclifier.org is interested in promoting “innovations that contribute to local exchange and production”, distances of producers to the foodbank and to the consumers are indicated on a somewhat logarithmic scale.

I just doubt that roughly a third of the output flows from food production is received by the foodbank. This is probaly to be taken symbolically and not for real…

Very cool Sankey diagram, kudos!