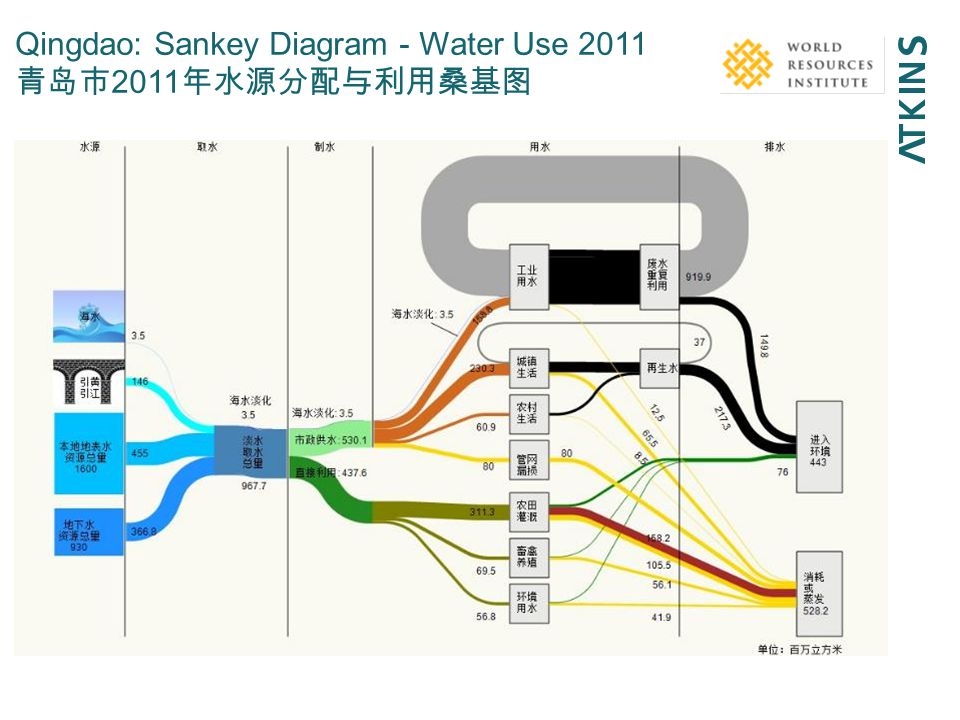
Interesting Sankey diagram on water use in Qingdao, China in 2011. This is from a presentation titled ‘Urban water security – Water-energy-food nexus’ by Josh Weinberg of Stockholm International Water Institute. Atkins and World Resources Institute (WRI) appear as co-authors.
Unit of flow seems to be million m³ (百万立方米). Water origin is mainly surface water (455 mio m³) and local ground water (367 mio m³), with some additional (146 mio m³) brought in from Yellow River and Yangtze River.
Not sure about the split shown with two green flows, possibly breaking down the water use to urban (city of Qingdao) and province.
The middle part shows consumers: Farming (?) is largest consumer with 311 mio m³ per year, followed by ??? with 230 mio m³, and use in industry with 153 mio m³. Polluted water is shown in black.
Maybe someone who reads Chinese wants to chime in…

