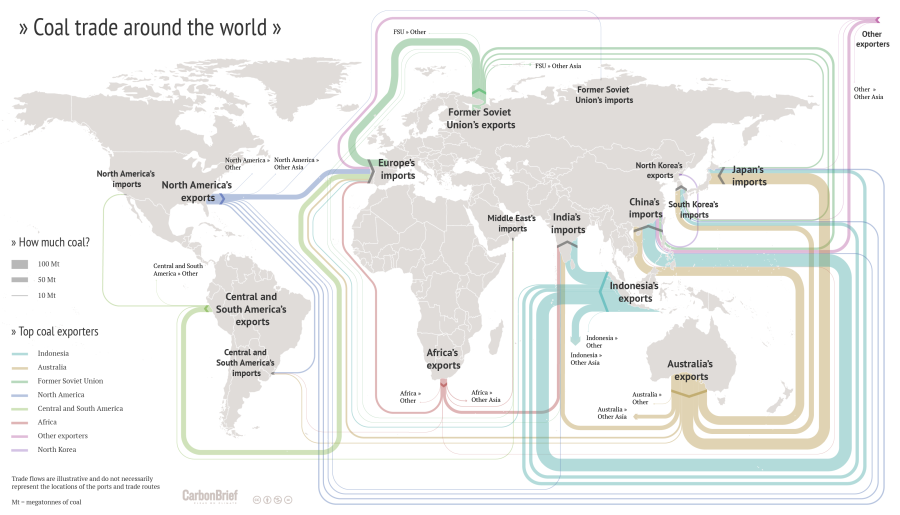
Drawing Sankey diagrams on a world map to show flows between different geographical location is always a challenge. One of the inherent problems is that large (=broad) arrows may run between two points on the map located very close to each other. Another problem is that one wishes to have the arrows more or less along the actual trade routes, which in many cases is close to impossible (take, for example, ships going through the Panama or the Suez canal).
I have shown quite a number of ‘Sankey diagram maps’ here on the blog, but most of them had shortcomings. Now here is an example that does extremely well in tackling the issue of Sankey diagram flows on a world map.
(CC licence – Carbon Brief)
This flow map of coal exports around the world shows the top exporters. It was crafted by Rosamund Pearce for the Carbon Brief article “Mapped: The global coal trade”. She decided to route the Sankey arrows nicely sorted, in parallel, and not along the actual shipping paths. See how much of the coal trade from Indonesia to China is led “virtually” south of Australia and New Zealand? Additionally the arrows are not led precisely to the actual port, but rather connect at a suitable place of each continent. With these simplifications the trade flow map is much clearer, understandable.
Another world coal flow diagram from 2012 can be found here.

