Great find by a follower of this blog who send me a link to this report in German available on the website of the German EPA (‘Umweltbundesamt’). The title translates as ‘Climate protection and regeneratively generated chemical energy carriers – infrastructure and system adaptation for the supply of regenerative chemical fuels from domestic and foreign regenerative energies’.
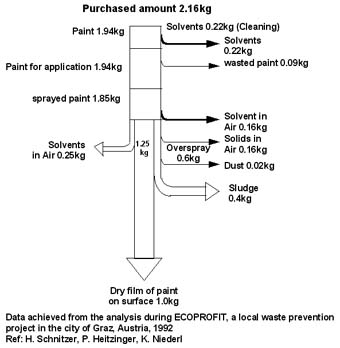
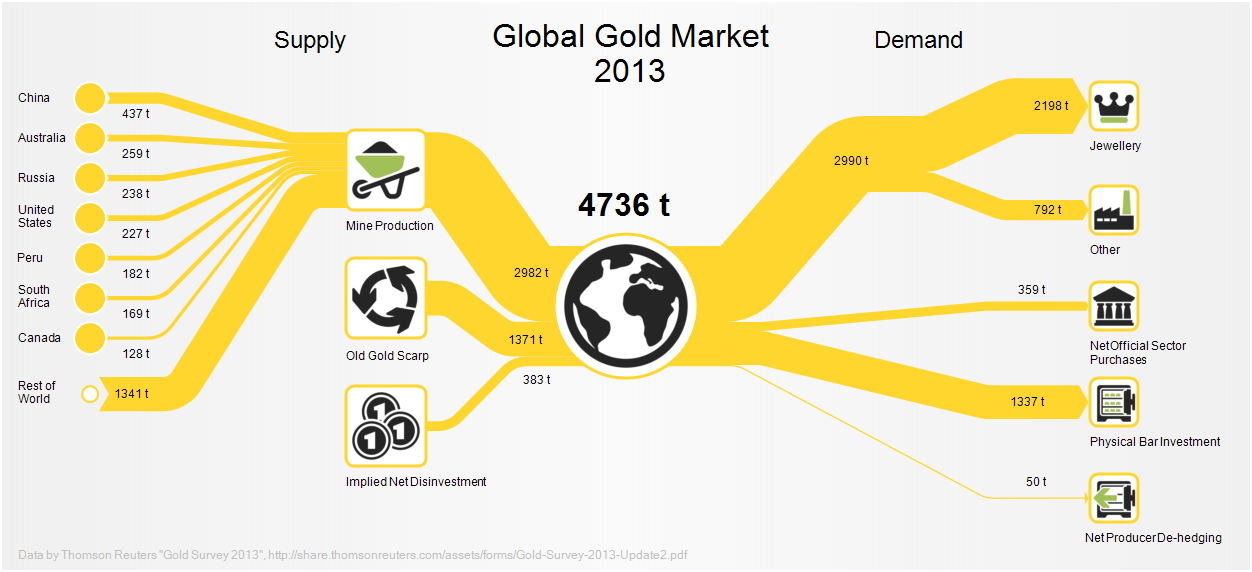
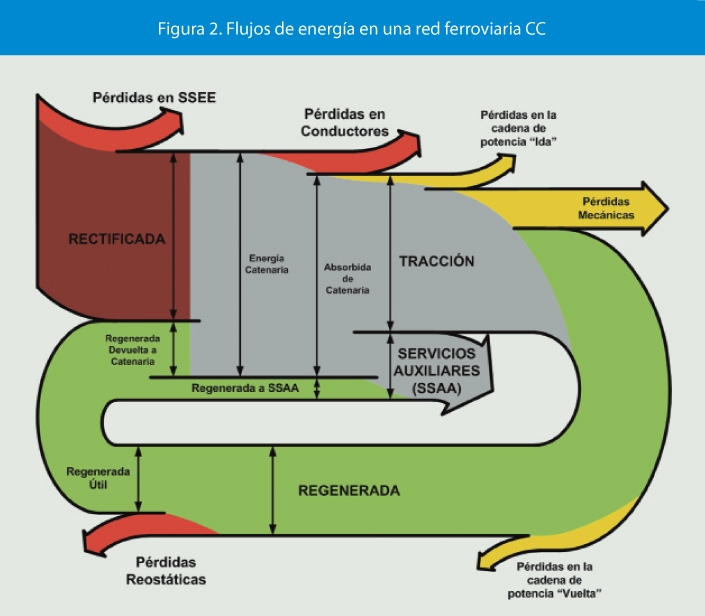
The report contains Sankey diagrams on 40 pages (!) like the two shown below. All of them are structured the same way with a vertical layout: a certain amount of energy available at production site, losses branching out to the right, and useful energy available on site shown as the remaining arrow at the bottom (colored in green).
From the management summary in English we learn that “this project aims at gaining first insights into the potential of renewable chemical fuels from renewable energy sources both domestic and abroad as well as the associated transport requirements. (…) [P]otentials and transport infrastructure for using renewable energy to provide storable energy carriers were analysed, being followed by a systematic comparison of the import routes of renewable gases, namely hydrogen (eH2) and methane (eCH4)”.
The assumption is that there are countries (e.g. Norway) that may have wind energy in excess, and regions (e.g. Turkey, Spain) where there is abundant potential for solar energy (PV). This electricity could be used for methanisation (power-to-gas, P2G). Gas from renewable energy could be stored in the German gas grid. The Sankey diagrams then show power-to-gas transformation on site and transporting the gas through pipelines to Germany, compared to the scenario of transporting electricity on the grid (with the associated losses) and to produce methane in Germany.
‘Klimaschutz und regenerativ erzeugte chemische Energieträger – Infrastruktur und Systemanpassung zur Versorgung mit regenerativen chemischen Energieträgern aus in- und ausländischen regenerativen Energien’ by Stefan Schütz of DBI Gas- und Umwelttechnik, Leipzig and Philipp Härtel of Fraunhofer-Institut für Windenergie und Energiesystemtechnik, Kassel. Report published Aug 2016 by German EPA (Umweltbundesamt, UBA). Download full report PDF here.
Thanks Axel from Germany for pointing me to this.


