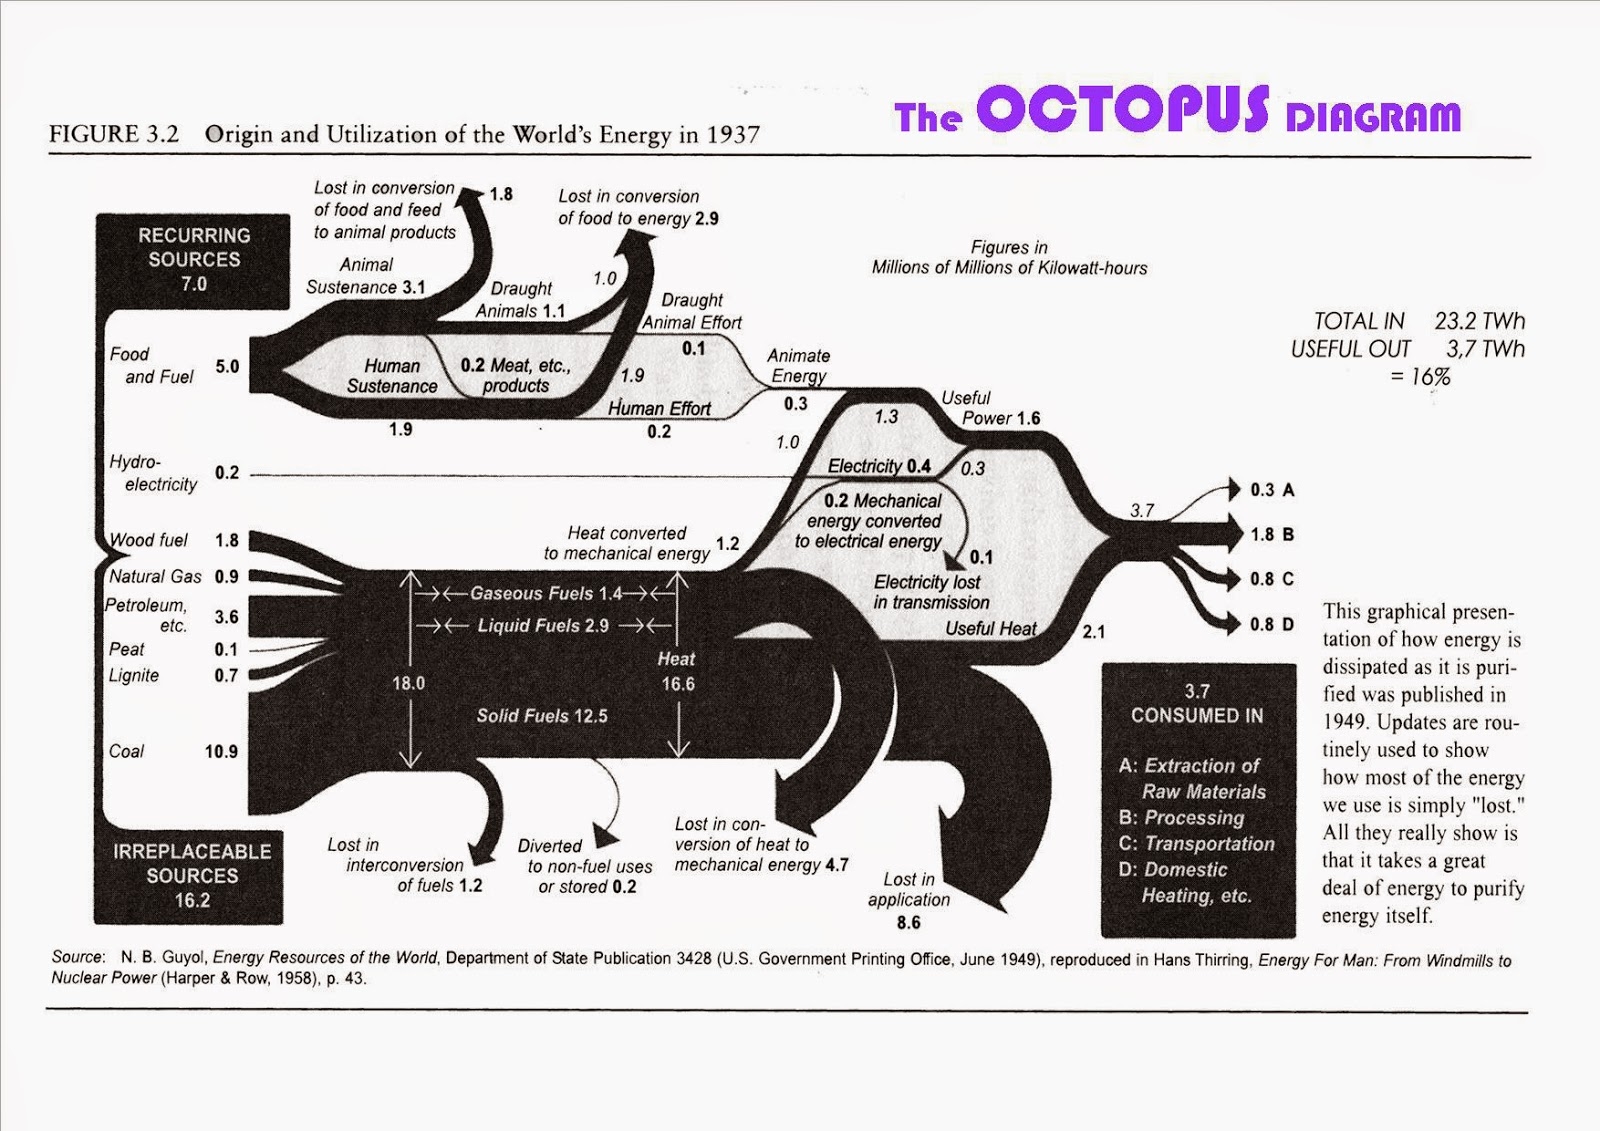
The below Sankey diagram from 1949 depicting world’s energy flows in 1937 is shown in this blog post by Michael Hohmann | LMH Design.
Flows are in TWh.
Michael says: “When I first saw this, I was reminded of seeing an octopus and called it an Octopus Diagram, with the octopus’ head at the input end at left, and the tentacles on the right, in between digesting and distributing everything that the various mouths at the head can gobble up”, asking himself “[w]here does all this Input energy disappear to with so little Output energy ending up as useful for us humans?”.
