Month: September 2018

Energy Efficiency of Ships, Deltamarin

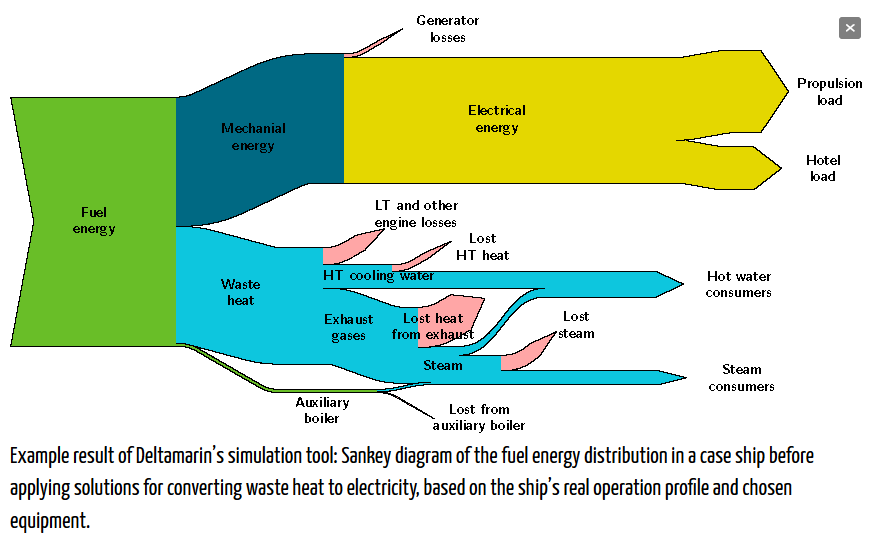
Deltamarin Ltd, a Finnish maritime engineering and consulting firm has developed a simulation and analysis tool, that allows to study the energy efficiency of ships. The model takes into account not only the vessel speed and fuel consumption, but also the secondary on-board electricity consumers and waste heat recovery. Results are shown in a Sankey diagram like the one below.


The Sankey diagram in this pic doesn’t show any numbers or unit of flow, so we can only conclude from the arrow magnitudes that about 50% of the energy is lost as heat at the engine (some of which is recovered for heating of water).
I am not sure about the propulsion being electric though.

The design of the diagram is rather crude and diagonal lines are visibly pixelated. But nevertheless it seems like a good way to get the energy efficiency model result data across other than in a table.

Watch this video where a Deltamarin engineer explains the simulation model and also the Sankey diagram.
Botswana Energy Flows

Botswana, a country with just over 2 million population, borders South Africa to the North. Would you be able to tell its capital?

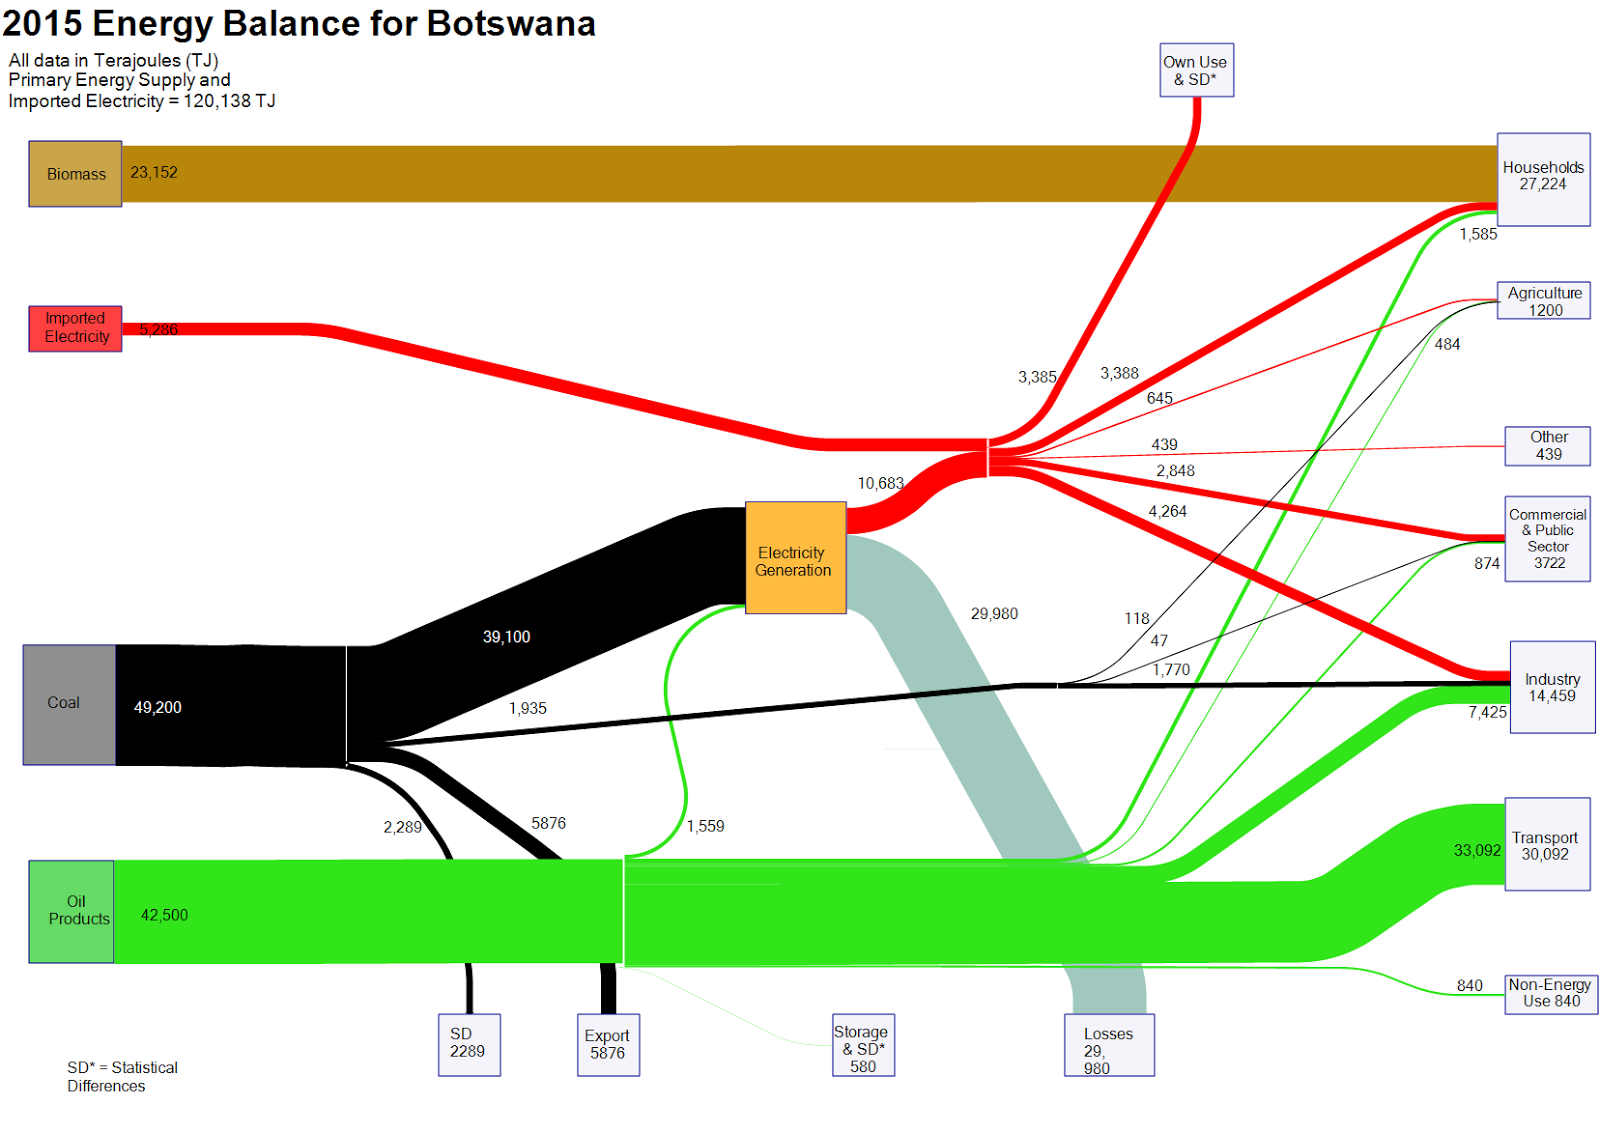
Nevertheless, a Sankey diagram with the energy balance of Botswana can be found on the web. Mike Mooiman, a professor at Franklin Pierce University, New Hampshire and a former visiting scholar at University of Botswana featured it on his ‘Energy in Botswana’ blog. These are the energy flows for the African country for 2015 (based on IEA data).


Flows are in terajoule (TJ) and overall energy demand was 120,138 TJ. Biomass (wood) is the predominant fuel in private households (e.g. for cooking). Locally mined coal accounts for 40% of the primary energy and is used for electricity generation with an efficiency factor of below 30%. Imported oil products account for over 40% of the energy consumed (mainly for transportation).

The 2012 energy balance for Botswana is also available on Mike’s blog.