Month: October 2018

LatAm BEN – Argentina

Recently I have been reading about energy policies in Latin American countries. Quito-based OLADE, the inter-governmental Organización Latinoamericana de Energía plays a key role in coordination and cooperation between countries in regard to energy.

OLADE has also established the SIER (Sistema de Información Energética Regional), and one of their products is SieLAC (Sistema de Información Energética de Latinoamérica Latina y el Caribe) where energy data for 27 countries can be accessed.

For all countries the national energy balance (Balance Energético Nacional, BEN) can be produced as Sankey diagrams for the years 2005 through to 2010. Further, these energy flows can also be shown for regions, such as the Caribbean, the Andean countries or the “Southern Cone”.

Here is the one for Argentina in 2010.

To try for yourself, just go to the sieLAC page and click on ‘Balance Energético Resumido’. Then select country, year and the unit.
Unfortunately, data for more recent years is not available at this time.

This work of OLADE has inspired me to start a loose mini-series of posts titled ‘LatAm BEN’ where I will be showing Sankey diagrams representing national energy balances from the region. Don’t worry, they will not all be from SieLAC, and will show how differently BENs can look like.
What’s in a Book? Sankey Diagrams!

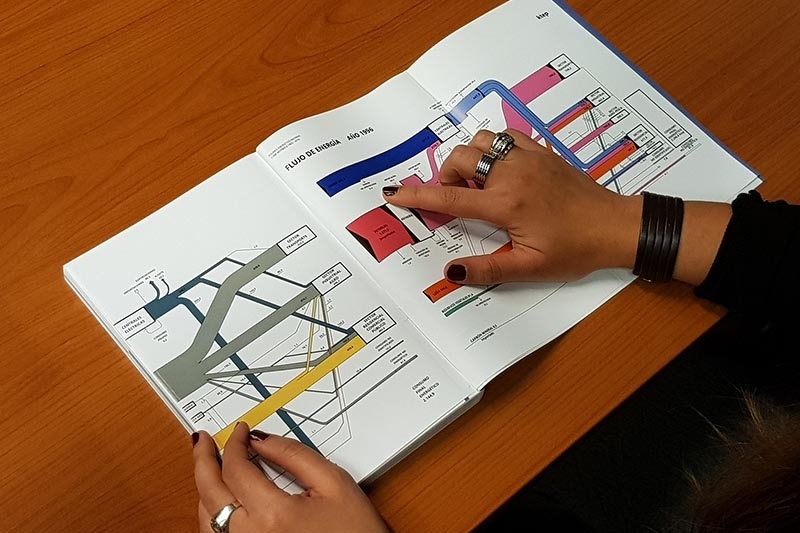
I would love to get a copy of the book shown in the picture below… but then it is probably just a symbolic photo of someone studying the energy balance of a country (the caption reads “Energy Flows Year 1996”).


This find has inspired me to a new mini-series of posts on national energy balances shown as Sankey diagrams with a focus on Latin America.

Here is the list with links to all post so far:
Argentina: 2010
Bolivia: 2014
Brazil: 2014
Chile: 2015
Colombia: 2012
Costa Rica: 2010, 2015
Ecuador: 2017
Guatemala: 2011
Honduras: 2017
Mexico: 2011 and 2016 (coming up)
Panama: 2018
Paraguay: 2017
Peru: 2009, 2017
Uruguay: 2015

Update 04/2020: I am still looking for energy balances for a number of Central American countries (Nicaragua, El Salvador) and for Venezuela on the southern cone. If you can point me to some sources, please leave a comment below.

Finland Wood Flows, Two Versions

The below Sankey diagrams both show wood biomass flows for Finland for the year 2013.

The first one was published in the report VTT Technology 237 ‘Sustainability of forest energy in Northern Europe’ by researchers from VTT Technical Research Centre of Finland and Natural Resources Institute Finland (Luke).


Authors of this figure are Eija Alakangas and Janne Keränen. The diagram is oriented top-to-bottom and shows how the 104.4 Mm³ of round wood that grew in Finnish woods in 2013 were used. Basically there are two (three) main pathways, with a lot of arrows branching out to depict certain uses. 38.3 Mm³ of round wood was used in pulp industry, 26.2 Mm³ in the mechanical wood industry. Another 9.5 Mm³ of wood is used directly for energy generation.

The second Sankey diagram seems to be a remake of the above. It was published in a VTT Research Report on ‘Cascading use of wood in Finland – with comparison to selected EU countries’ by Laura Sokka, Kati Koponen, Janne T. Keränen.


Here the overall orientation is left-left-to right. The color scheme seems similar. There are some minor differences in the energy use part (orange and dark red arrows).

The first diagram has some images and comes across a little more playful than the second one. Although they depict the same data, I perceive them quite differently.
Is it due to the scaling or the vertical vs. horizontal orientation? Let me know your impression in the comments please.

Sustainability of Olive Growing in Andalusia

The Niche Canada blog ran an interesting piece by Juan Infante-Amate from Unversity Pablo de Olavide in Spain titled ‘The largest tree crop concentration in Europe: The making of olive landscapes in Southern Spain’. It is a summary of research done on the changes in olive cultivation in Andalusia from traditional olive growing in the 18th century to today’s industrialized production.

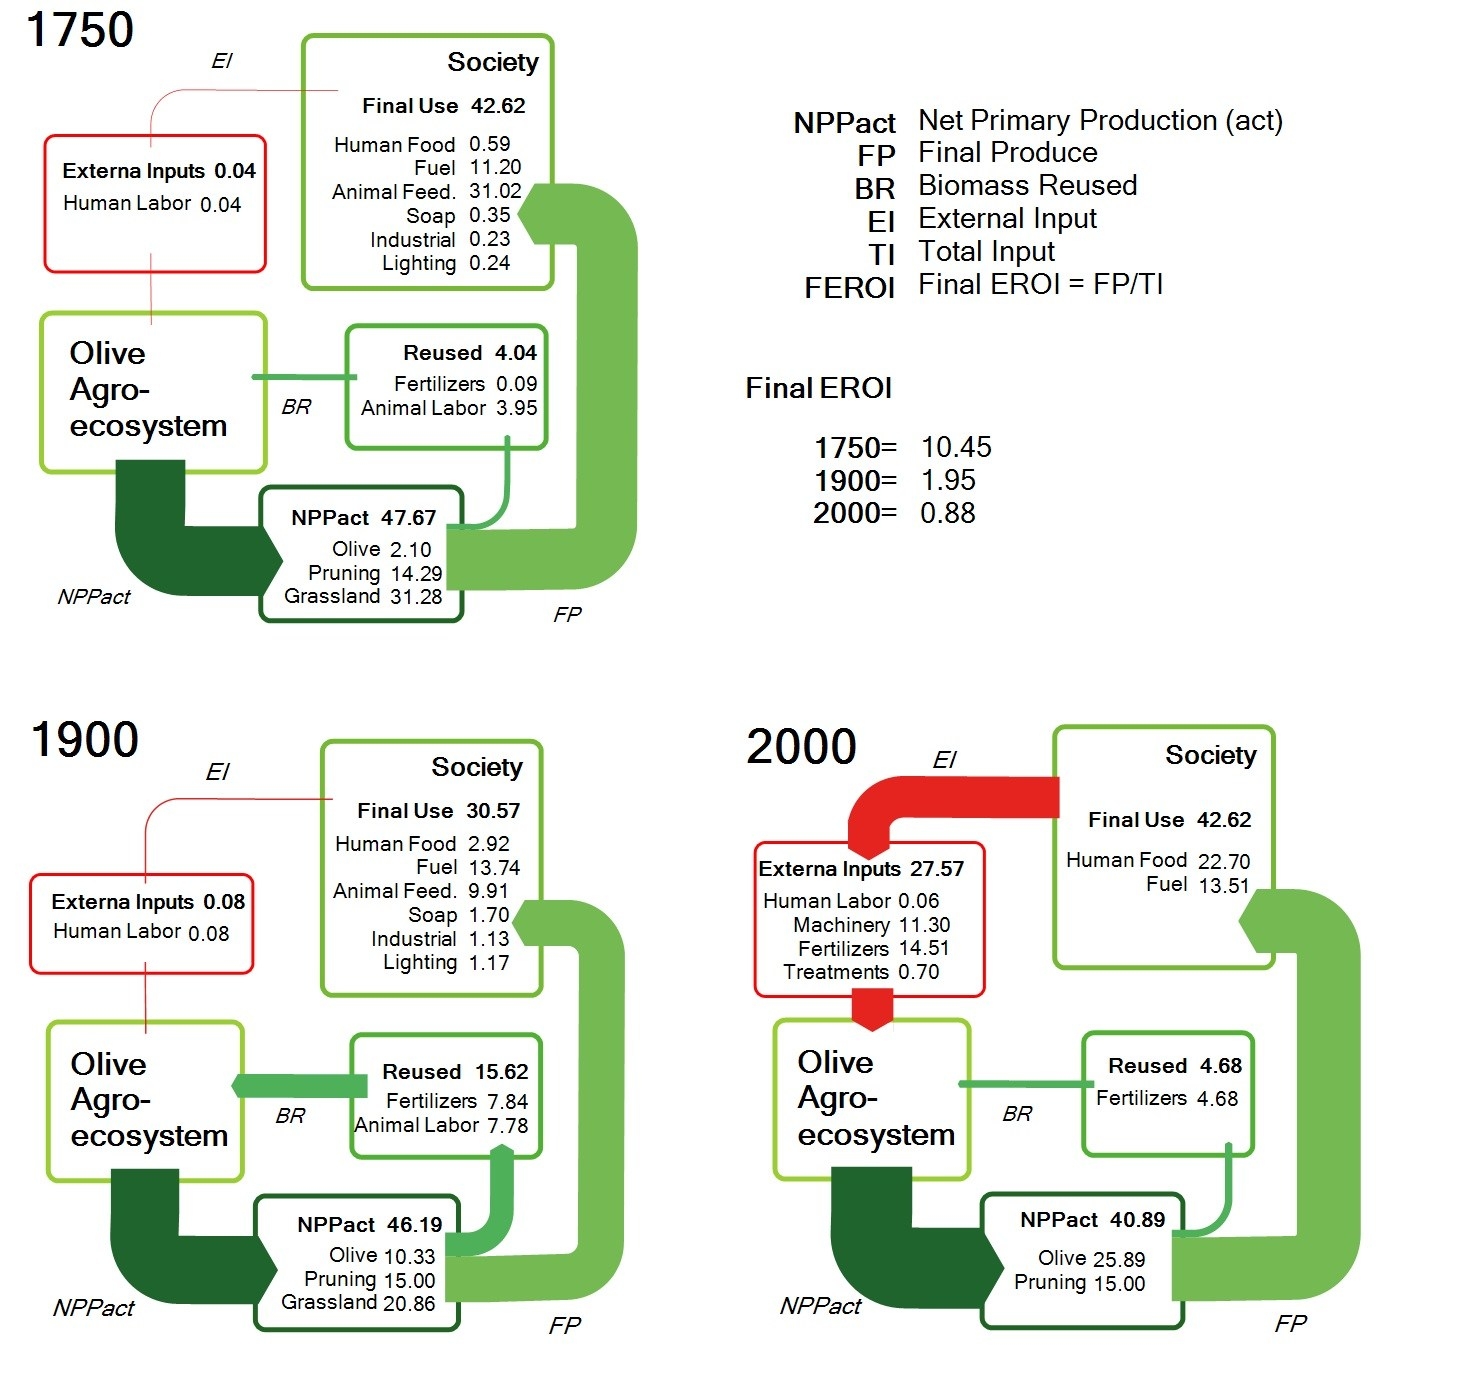
The post features these three schematic Sankey diagrams. Data is for one specific site:


(licensed under a Creative Commons Attribution-NonCommercial 4.0 International License)

The above are three snapshots of the energy flows of one production site in Andalusia in 1750, around 1900 and today. By relating the final product quantity (FP) to the total input of energy or work (TI) the researchers are trying to measure sustainability with the indicator FEROI. An indeed, “[e]verything suggests that over the course of the history of Mediterranean landscapes these current conditions have been the least sustainable.”

Interesting approach and use of Sankey diagrams to compare a sustainability indicator. References to the full research papers can be found at the end of Infante-Amate’s Niche Canada post.

Denmark Energy Flows

Denmark’s Energy Flows for the year 2016 were published by Danish Energy Agency (‘Energistyrelsen’).

For detail, I recommend to study the high-quality image of the Sankey diagam in this PDF.

Flows are in petajoule (PJ). Smaller flows are shown with a minimum width, so they are not to scale with the others, but remain visible. Even zero flows are shown, either because there is actually a quantity (less than 1 PJ) that is just rounded, or, because in other years there might be a flow quantity available for them. Arrows arrive at the nodes separately, their flow labels shown inside the node. This feature enhances legibility quite a bit.

Also see this 2012 post on a Denmark 2050 Nuclear Free Energy Scenario.

Living Sankey Diagrams

A reader of the blog, Olov, has produced the following video. He calls this a “Living Sankey Diagram”. The background can be found on the Sweco Blog (in Swedish). Basically he suggests to take energy declarations for buildings (‘Energideklarationen’) one step further and have visual energy monitoring for building using realtime data.

Energy consumption of a house is shown over a period of a year with up to 3 or 4 datasets per day. We can see heat (red) and electricity (orange). Not sure about the temperature indication at the top left, possibly meant to be the difference to a default temperature (Olov, if possible, please explain by commenting below).

Main consumers in the building are hot water generation (‘Tappvarmvatten’), room heating (‘Radiatorer’), ventilation and cooling. Some PV cells (‘Solceller’) at times add to the purchased energy (‘Köpt Energi’). The pink flow shows heat recovery (‘Värmeåtervinning’). The building is classified in energy class B.

Here, a data series has been used to produce the Sankey diagrams and then the frames were converted to a video. This makes for a nice effect and allows watching your energy flows in retrospect. For example, the PV cells feed energy mostly during the months, while in the same period heat demand and recovery is very limited.

This was apparently produced using e!Sankey. To really do an energy monitoring and produce the Sankey diagram every couple of minutes, there is a software development kit (SDK) the allows linking to a data source (energy measurement data) and pushing the “living Sankey diagram” to a website. Another example can be found here.