Month: April 2020

1913 public transport 3D map

Leafing through Brinton’s 1914 book ‘Graphic methods for presenting facts’ I found this example of a 3D map that has elements of a Sankey diagram.

This map (photo taken from an exhibit at a 1913 exhibition) shows passenger numbers on the Frankfurt streetcar lines (back then when trams were still called streetcars!)


Brinton explains that “we have a map presentation in which quantities are represented by building vertically above the various routes laid out on the map … made by strips of wood, alternately black and white, glued carefully above each one of the street-car routes. Each of the strips of wood represents 4,000 passengers carried on the street-car lines in 24 hours” (page 224).

The built up flows showing passenger numbers would, if laid sideways, indeed make a Sankey diagram. Building them up using the third map dimension avoids the issue of dealing with wide Sankey arrows in a dense city center, where passenger numbers are highest.

Brinton’s book, although over 105 years from its publication still makes for a great read (as does his 1939 book on ‘Graphic Presentation’, which is basically a sample book for doing infographics).
LatAm BEN – Peru

Here is another post in my loose mini-series featuring energy balances of Latin American countries. I had shown Peru energy flows for 2009 in this post, but here is a more recent one for 2017.


This is from page 122 of the official ‘Balance Nacional de Energía 2017’ report published by Ministro de Energía y Minas (MINEM) of Peru. PDF here.

Flows are in terajoules (TJ). Natural gas and hydro energy are the two largest sources. Transformation losses (pérdidas de transformación) amount to 45%. The split on the consumption side separates mining from industry, and we can see that this sector is the largest energy consumers.

Energy Use per Industrial Sector, Indonesia

The article ‘Tracing the energy footprints of Indonesian manufacturing industry’ by Yales Vivadinar, Widodo W. Purwanto & Asep H. Saputra from Department of Chemical Engineering, Universitas Indonesia, Depok, Indonesia (published as Open Access in: Energy Science and Engineering 2016; 4(6): 394–405) looks at typical energy usage in different industrial manufacturing sectors in Indonesia.

There are Sankey diagrams representing “energy maps” for basic chemicals, cement, pulp, paper, spinning, weaving and textile finishing. I am showing two of them below. The first one is for the basic chemical industry.

Flows are in kboe (thousand barrels oil equivalent) for the year 2013. Losses are shown as grey arrows. The second one is for textile finishing:


For those of you interested, please read the full paper here.

New York Zero Waste Scenario 2030

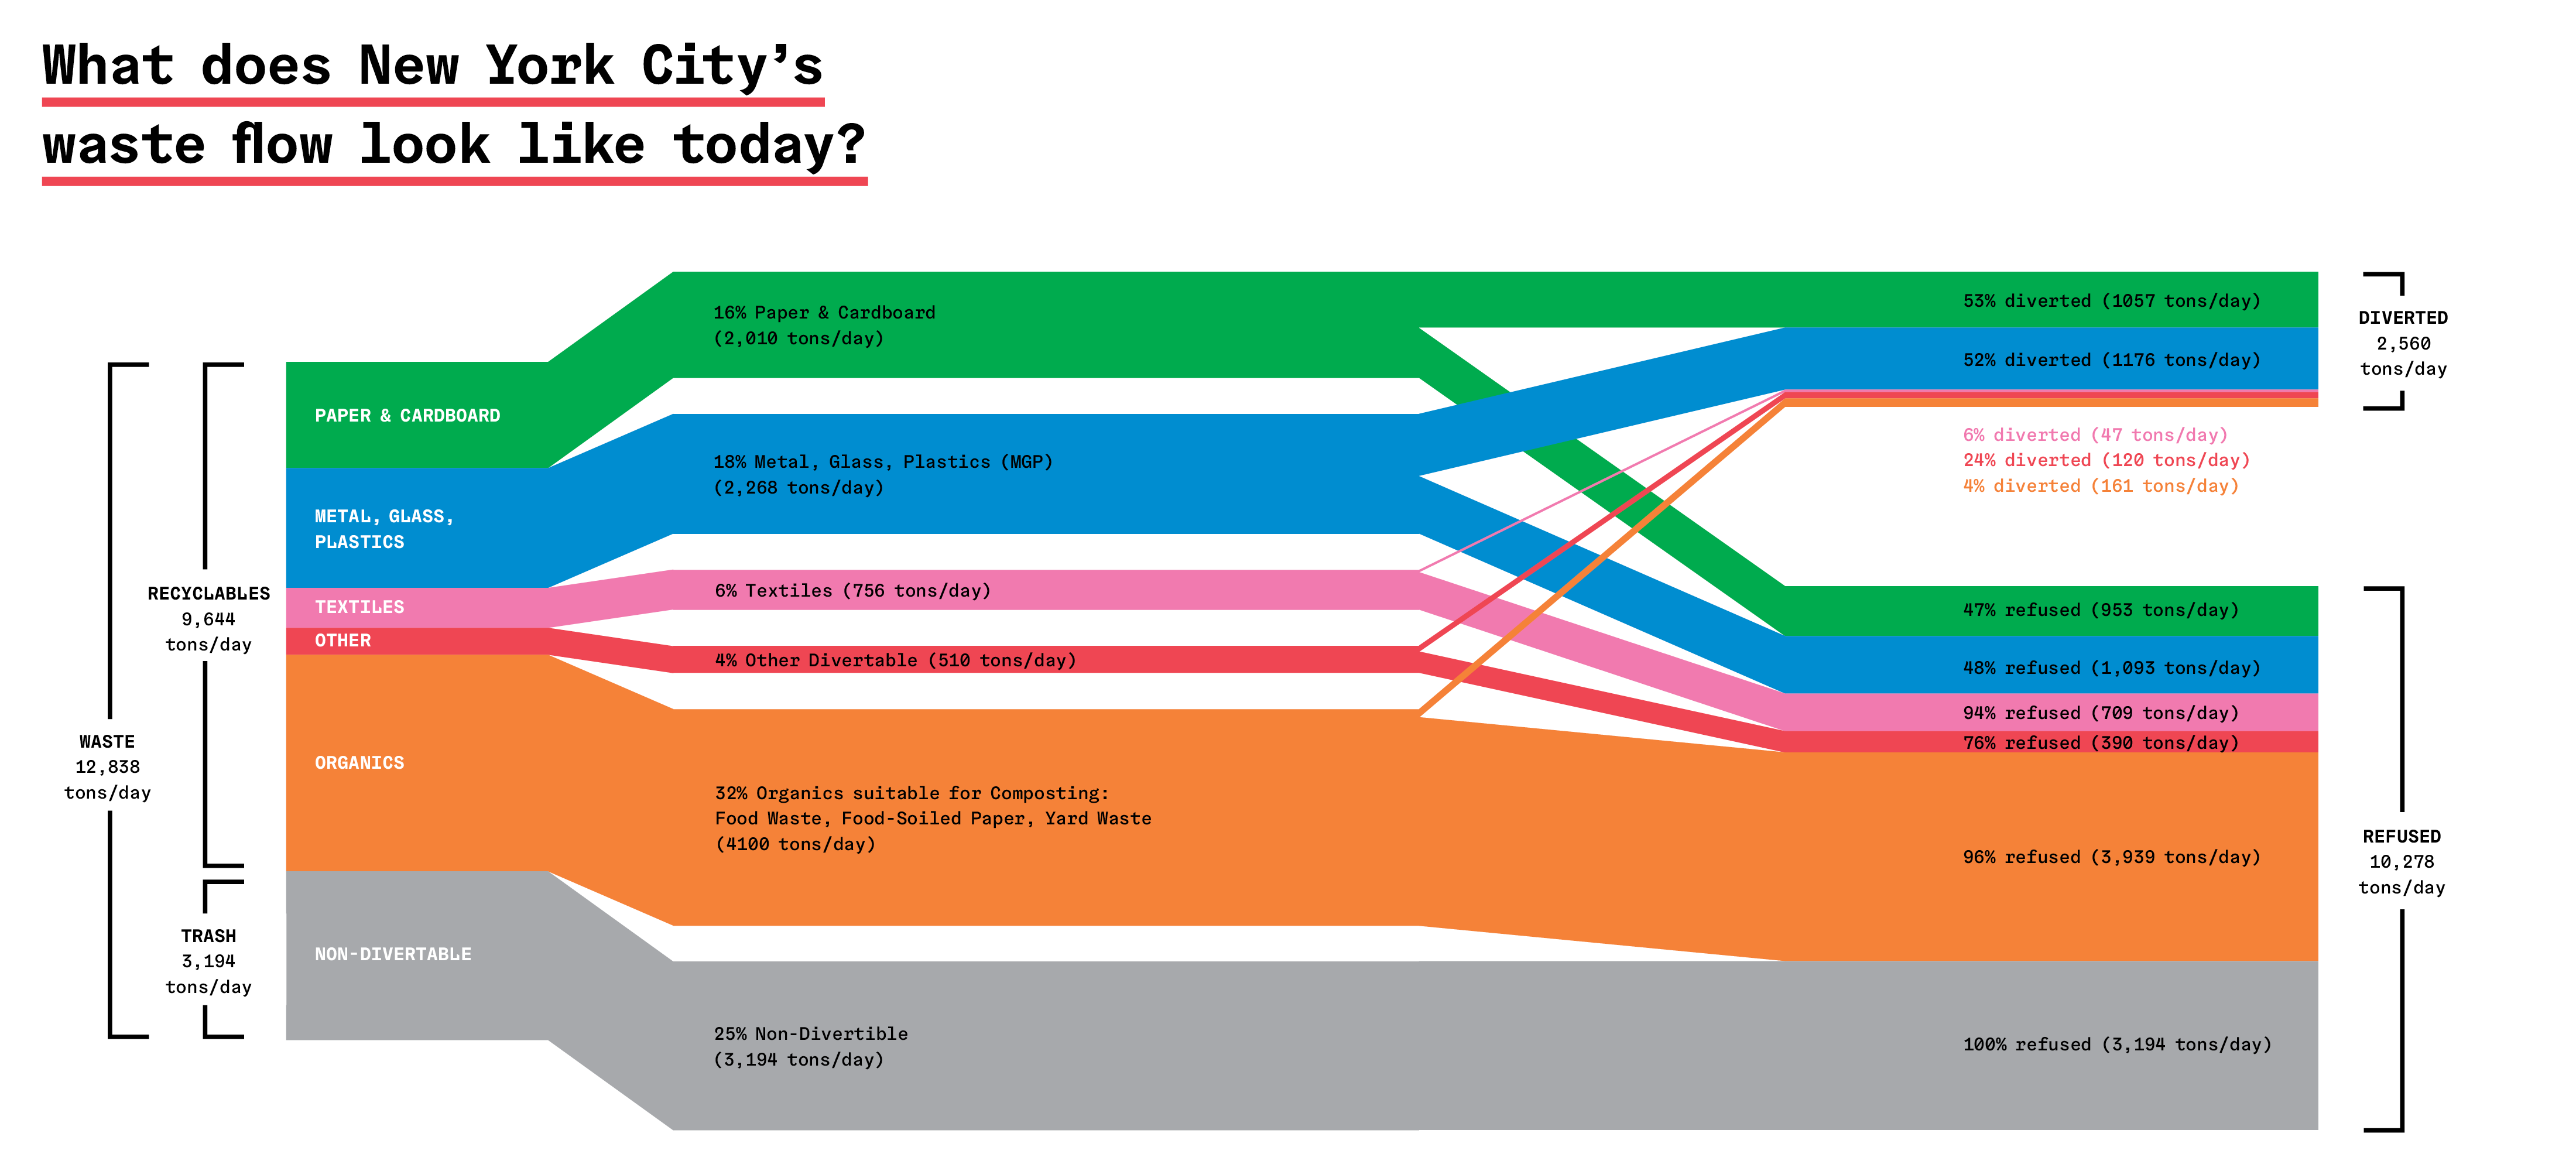
Came across an interesting article by Tei Carpenter, ‘Waste Not, Want More: Zeroing In on Designing Waste’ in the Avery Review 33 (September 2018). It describes a transition to a zero waste scenario for New York in 2030.

This is the Sankey diagram for the waste situation today (that is… 2018). An incredible 12,838 tonnes per year day. Of which 75% would theoretically be recyclable. Instead, 80% end up as refuse, while only 20% are “diverted”.


There is also a second Sankey diagram that shows how the city would handle its waste in 2030 with a zero waste strategy. Read the article at Avery Review or download as PDF.

Non-Ferrous Metal Waste Paths

Another spectacular Sankey diagram from the final report of the project “Resource conservation through material flow-oriented secondary raw materials management” published by German Environment Protection Agency (Umweltbundesamt, UBA). This one is on non-ferrous metals in waste and recycling paths Germany. Flows are in mio. t for the year 2013.


I had presented another Sankey diagam from this report (on paper and cardboard streams) here on the blog back in January. You can access the full report here.