Month: August 2020

Wood Biomass in The Netherlands

This Sankey diagram on wood biomass flows in the Netherlands is featured in the study ‘Sustainable biomass and bioenergy in the Netherlands’ by Goh, Mai-Moulin and Junginger from Utrecht University.


Flows are in million tons (MT) dry mass for the year 2014. The diagram has a very clear structure. Import streams are from the top and exports leave to the bottom. Domestic Dutch production is from the left, use of wood biomass in the Netherlands is to the right. Paper and cardboard, alongside pulp are the largest flows, but mainly being imported and exported again, or circulating domestically as recycled paper.

The report has two other Sankey diagrams on oils and fats and carbohydrates used in different sectors in the Netherlands. See the full report here.
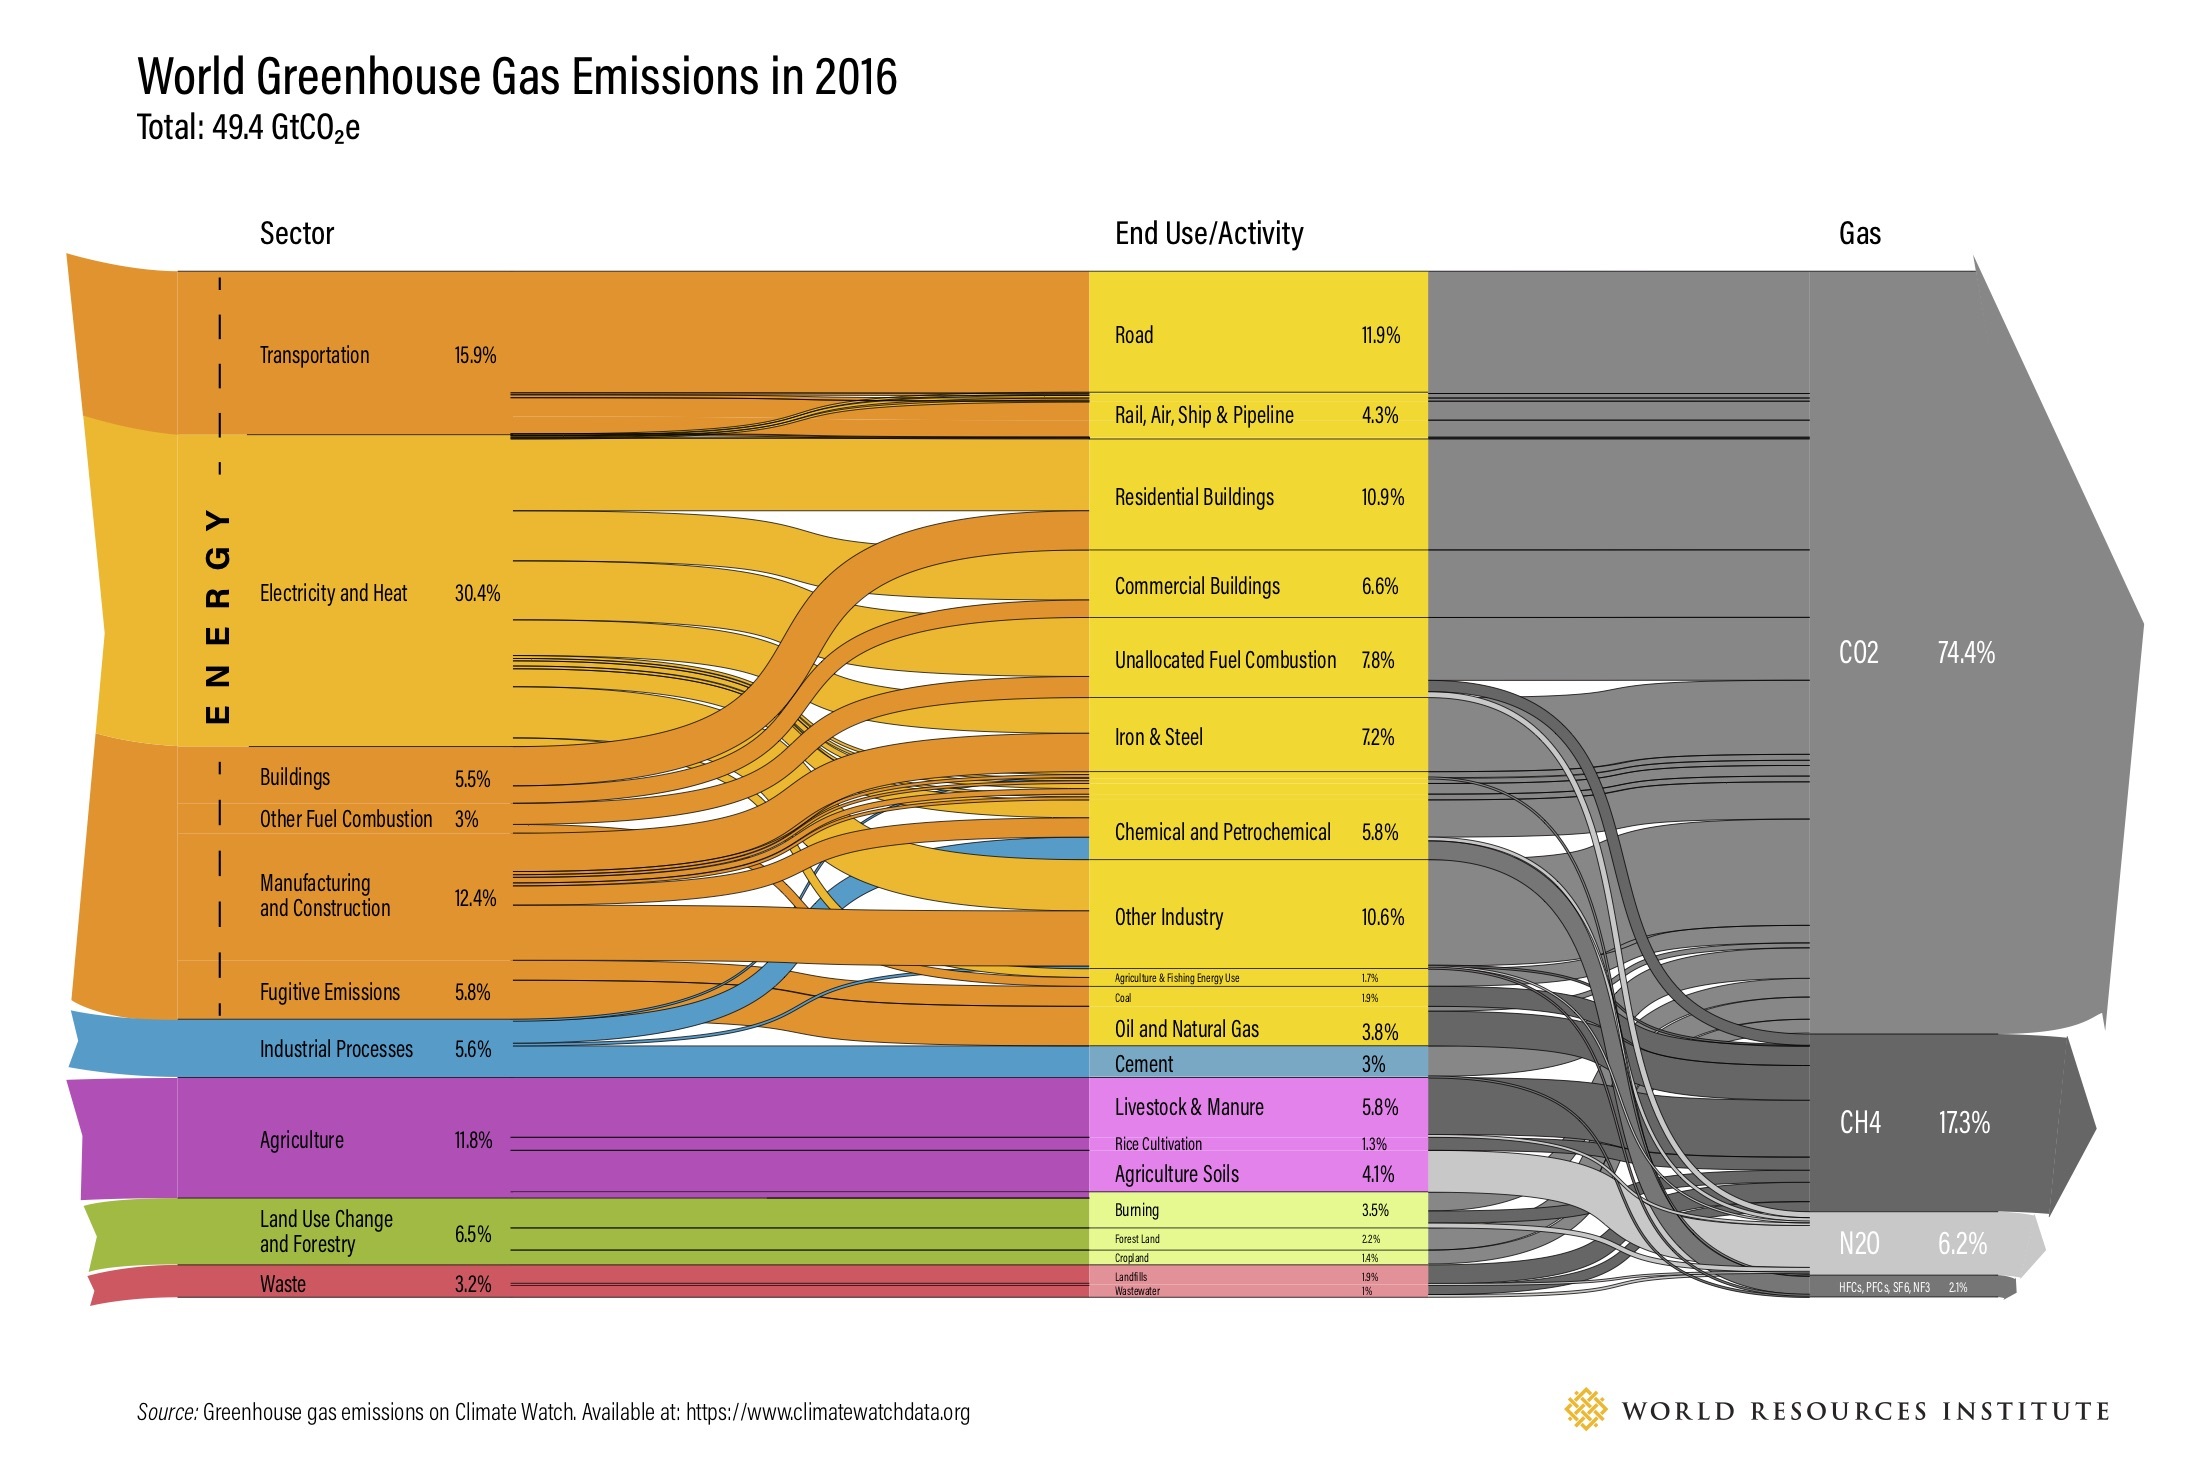
World GHG Emissions 2016

Here is an updated version of the world greenhouse gases emissions diagram for 2016. This was published 2019 by World Resources Institute (WRI) on their website.


Flows are in giga tonnes CO2 equivalents (GtCO2e). Overall emissions contributing to climate change were 49.4 GtCO2e. The first column is a breakdown per sector, the second one lists the activity causing the release. The third column shows the actual gas (GHG)

You can compare the quantities to the previous editions with data for 2000 and 2012, but mind that these figures are structured differently.

In addition to this “static” Sankey diagram there is also an interactive version that lets you explore the individual streams by hovering the mouse over the diagram.

If you like WRI’s work you might want to consider supporting them.

LatAm BEN – Costa Rica

Here is an add to my mini-series on energy balances of Latin American countries. I had previously featured Costa Rica’s balance energetico nacional for 2010. So here is an updated version for 2015.


This is from a report ‘Matriz Energética de Costa Rica. Renovabilidad de las fuentes y reversibilidad de los usos de energía’ by Diego Zárate Montero and Remigio Ranírez García’ published October 2016 (available here). Flows are in TJ, and data from the Dirección Sectorial de Energía. This 2015 version is based on the design of the 2010 version, and you can compare them directly to see, for example, changes in energy consumption per sector.