The following Sankey diagrams are from a report published in 2005 by Austrian Environment Protectionn Agency (UBA). The report is on energy efficient technologies and measures to increase efficiency and features practical examples from industry.
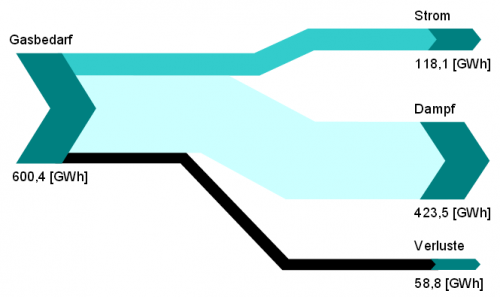
Both Sankey diagrams are from the section on cogeneration (chapter 5, p. 105 and p. 106). The first one shows how natural gas is being used to create 118 GWh electricity and 423.5 GWh steam with an efficiency of 90%.
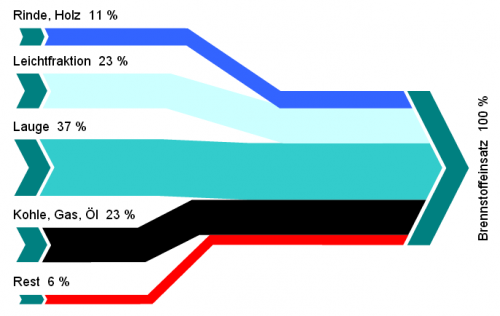
The second diagram is the breakdown of fuels used in another industrial cogeneration plant. It only features percentage values.
Both sets of data could also be displayed in pie charts, but the Sankey diagrams with directed arrows make an allusion to the output from gas, and to the input feed (in the second diagram).

