Tag: animated

U.S. Energy History 1800-2019

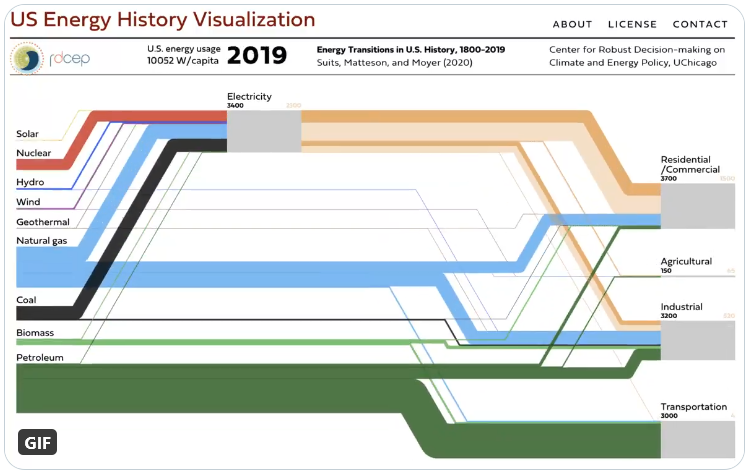
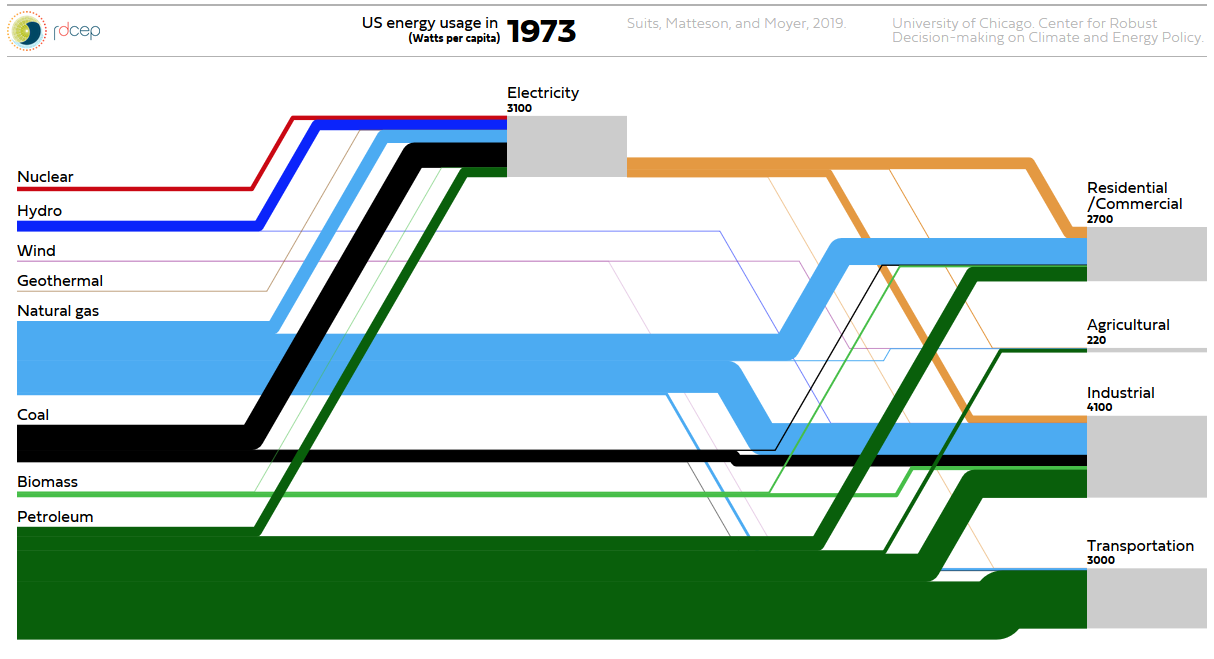
You can watch the changes in United States energy generation and use in a very cool animated Sankey diagram.

This was developed by University of Chicago’s Center for Robust Decision-making on Climate and Energy Policy (RDCEP) and is based on Suits, Matteson, and Moyer (2020) “Energy Transitions in U.S. History: 1800–2019”.


Click here to access RDCEP website and view 220 years of U.S. energy history.

You can play the whole period or use the timeline slider to jump to a specific year. At the top, next to the year, see the per capita use of energy rises from 3.660 W/cap to over 10.000 W/cap today.

Visualizing Internal and External Heat Flow

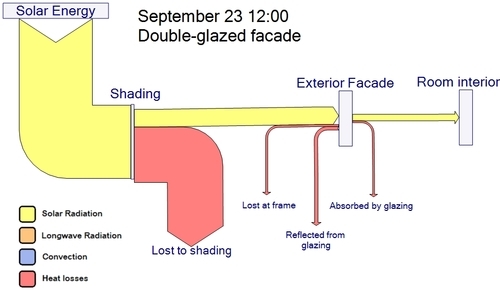
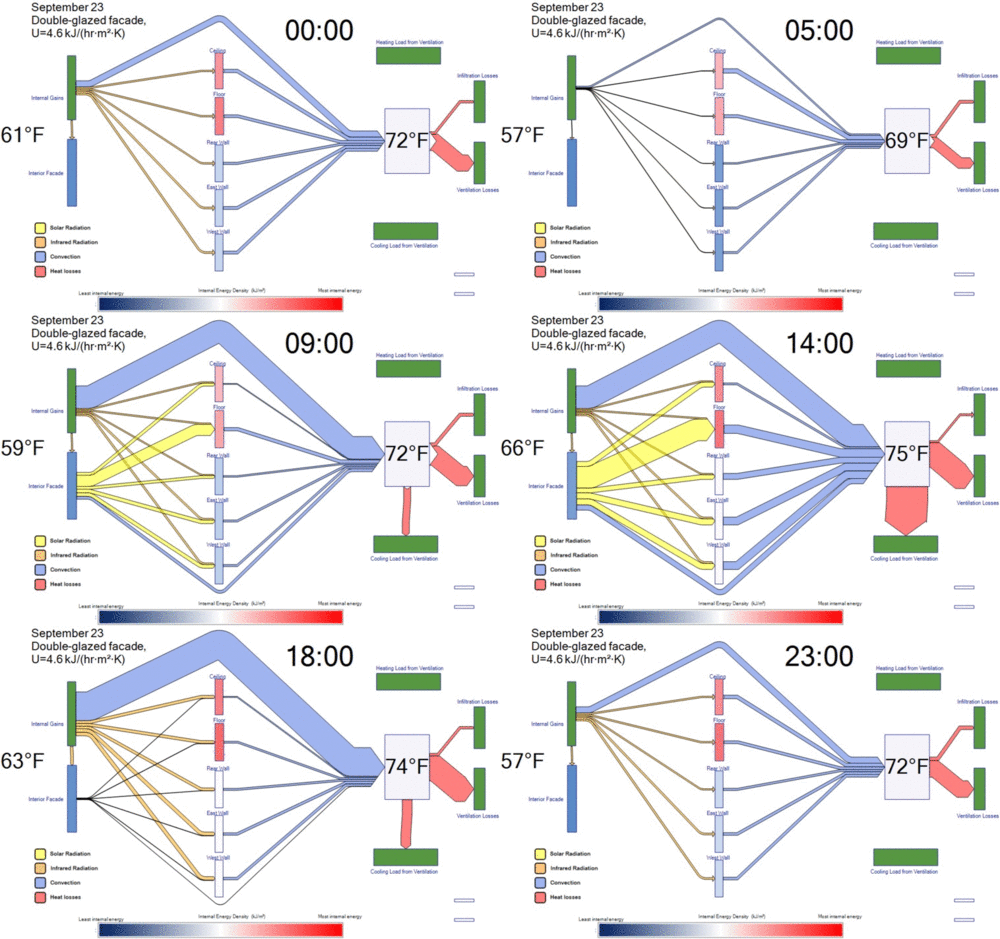
This post on the Transsolar ‘Green & Sexy’ blog features two Sankey diagrams. The “climate engineers” at Transsolar use them to model heat flows inside a building based on outside temperature and solar radiation.

No absolute values are given in these demo Sankey diagrams, but one can still get a general idea by observing proportions. Flows are color-coded with solor radiation in yellow, convection in blue, and heat losses in red.

The second Sankey diagram shown is a timeline made 24 frames – one per hour over a full-day. As the outside temperature rises and solar radiation increases around noon, the inside temperature and cooling demand increases.

(via tumblr)

Sankey diagram timeline by Transsolar

The authors explain:

“These Sankey diagrams allow us to see the proportion of how much energy is hitting the facade, how much energy is being radiated into the walls, how much energy is being convected into the air, and how much heating or cooling is actually needed to maintain an acceptable indoor air temperature. The animation is the first example we’ve ever seen of a Sankey diagram that represents the dynamic, ever-changing relationship of heat flows in a building with time.”

Sankey Diagram Video Production Line

Just discovered this new Sankey diagram video via e!Sankey Forum. Apparently just meant as a a show case for the possibilities offered by the e!Sankey software development kit (SDK).

We can see mass flows on a production line with two machines feeding ‘Item A’ and ‘Item B’ into the main production line.

These seem to be hourly flow values over a 30-hour time span. There are some red warnings indicating low buffer, and even one or two times when the production runs dry. Interesting…

Found that there are some more (educational) videos on youtube now that deal with Sankey diagrams.

Sankey Diagram in Visual Reports

I was very delighted to see a blog post on visual reports on Arup’s fieldofactivity.com blog with an embedded video that has Sankey diagrams.

Arup Australasia’s Digital Innovation Team is working on interactive reporting technologies. They say that “… not everyone reads technical reports, so this is the beginning of what’s next – visual reports.”

Check out the video, it is interesting, and watch out for the Sankey diagram seconds 0:15 to 0:21

What we see is a Sankey diagram unfolding in an animated sequence. One step further would be animated Sankey diagrams, like the research project I posted about that came up with a Java/Quicktime animation on energy flows, and this Sankey animatedGIF on CO2 and energy from 1990 to 2015.

Any other animated Sankey diagrams out there…?…

U.S. Oil Import Sankey Movie

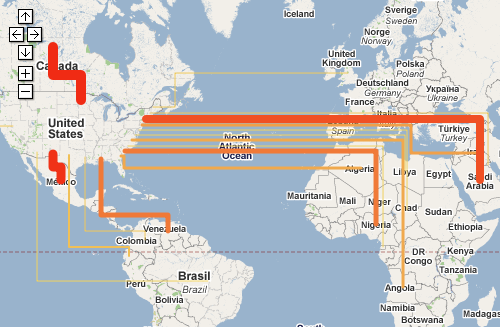
Renown Rocky Mountain Institute (RMI) founded in 1982 by Lovins and Lovins have an interactive oil imports map on their MOVE project webpage.

You can see the oil imports to the United States from January 1973 to August 2008 on a map that depicts the flow quantities as Sankey arrows linking the country of origin and the U.S. If you switch to the unit “Dollar”, you can see the value of the oil imported depicted as Sankey arrows.

One can play the the whole 35-year period as a movie, or use the slider on the time line to see individual months. The data used is from publicy accessible EIA/DOE statistics.

The United States is still 60 % dependent on imported oil. MRI’s MOVE project seeks possibilities to reduce foreign crude oil dependencies. The goal is to “get completely off oil by 2050, led by business for profit.”

Go to the RMI movie page and try it yourself. When I did the Lybia Oil Export map last year I wasn’t aware of this Sankey movie, which is of course much nicer.

Sankey – the movie. Or: moving Sankey diagrams

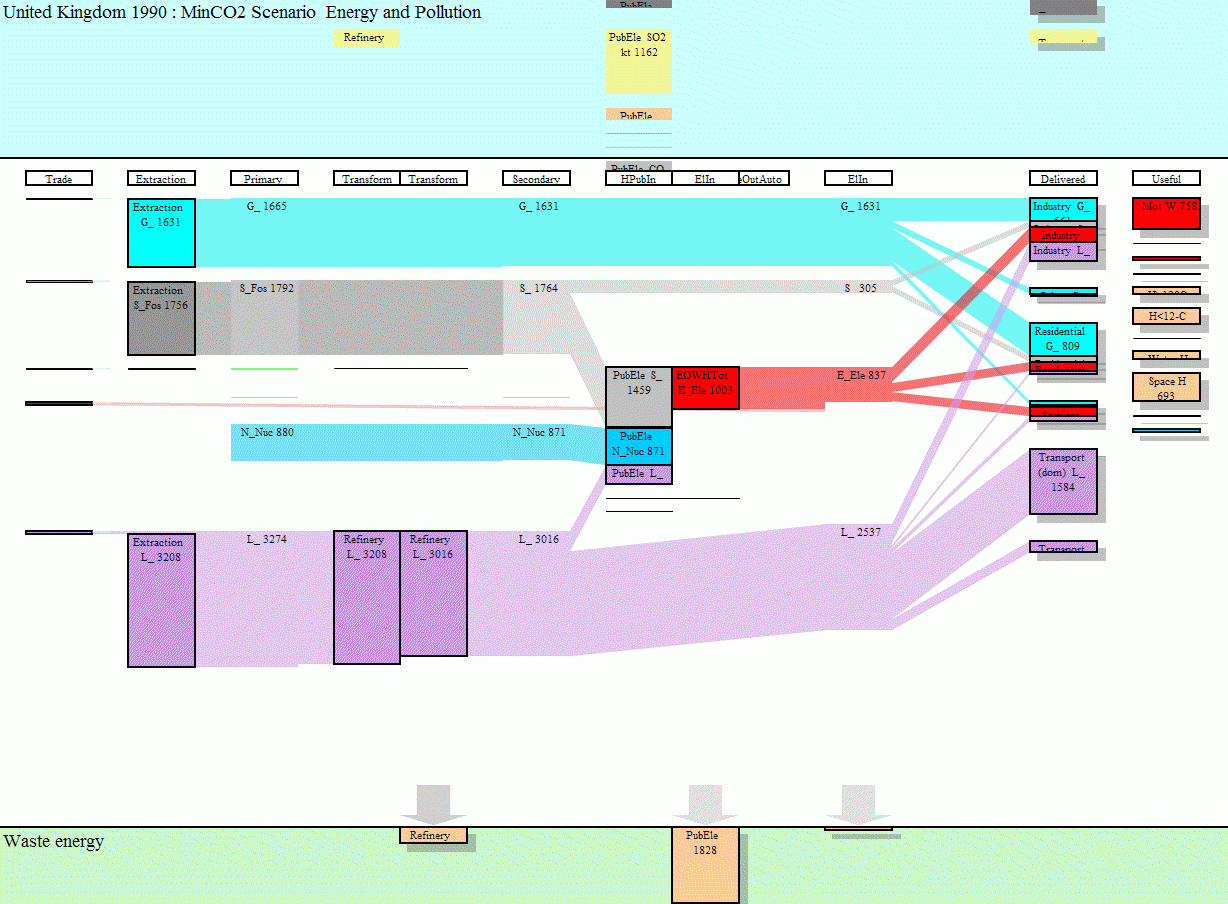
Mark Barrett, director of a UK-based energy consultancy Senco, has developed several energy models.

The SEEScen model (Society, Energy and Environment Scenario model)…

…incorporates 11 energy end uses (motive power, lighting, heating etc.) across 15 sectors. Some of these end uses have physical models; for example, domestic space heating and cooling are estimated with a model of a house which allows the effects of parameters such as insulation and internal temperatures to be examined.

Sankey diagrams for several years have been put together to make a short “film” how energy requirements may change over the years, and what shifts might be expected between different ways of energy generation.

To view this animation click on the image (there are some seconds between the frames, be patient).

To be able to see the details, download the Flash move or the GIF from the SEEScen webpage. Make sure you watch the film in the original size.The website www.senco.co.uk has gone offline (?), go to Mark Barrett’s page instead.

This is a neat idea, and it gives a whole new dimension to Sankey diagrams! On a side note: as far as I am informed, there are only two software tools capable of handling timelines in Sankey diagrams, S.DRAW and SankeyVis.…