Tag: boiler

Heat Flow Retro Sankey Diagram Remake

‘Dubbel’s Handbook of Mechanical Engineering’ could be considered a bible for mechanical engineering students in Germany. Despite its 900 pages it is still called a pocket book (‘Dubbel – Taschenbuch für den Maschinenbau’) in German quite euphemistically. Since it was first published in 1914 by Heinrich Dubbel it has seen some 24 editions and roughly 920,000 copies sold. Since 1994 it is also available in an English translation from Springer Publishers.


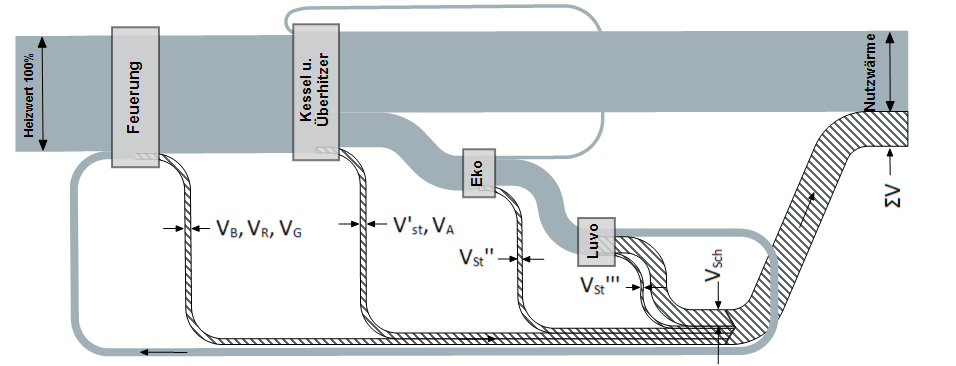
Someone challenged me, if I could do the above figure from Dubbel’s book (“Wärmestrom in einer Kesselanlage”, heat flow in a boiler system). I did various copies and here are the two I like best:

In this version losses are shown in grey with a gradient to dark grey.

The other one sticks closer to the original with the hatch pattern on the arrows representing losses. I had to fill the nodes since the contrast between the colored arrows and the hatched arrows was just too harsh.

I confess I couldn’t do the labels with prime marks and subscript directly in e!Sankey. So I did them in Word, created tiny images and rotated them as work around. Later I found out that the whole image was probably originally intended to be displayed vertically, but rotated to the left only to save space in the book.

Anyway … a fun challenge. I hope you like the result. Let me know your opinion.
Diagramas de Sankey? Si Se Puede!

The Mexican National Commission on Energy Saving (Comisión Nacional para el Ahorro de Energía (CONAE) present several success stories (casos exitosos) on their website.

One success story dates back to 1997, and describes how an energy efficiency study of fired heaters (i.e. boilers) was carried out in a Nafta producing facility in the Veracruz state of Mexico. As a result of the study, several suggestions for optimization were implemented. Fuel consumption could be reduced by 23-24 %, while the efficiency of the ovens could be raised by 13% (calentador BA-2001 B) and 16% respectively (calentador BA-2001 A).

Para los hispanoparlantes: el título oficial del proyecto fue “estudio técnico económico e ingeniería conceptual realizada a los calentadores a fuego directo BA-2001 A/B de la planta hidrodesulfuradora de naftas, del C.P.Q. “La Cangrejera”, ubicado en Coatzacoalcos, Veracruz” (otro candidato para el concurso mundial de titulos largos).

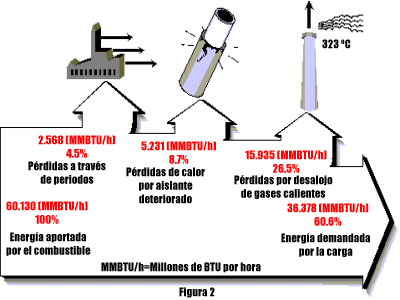
The heat losses are shown as Sankey diagrams. The first describes the optimal situation, with an energy efficiency of 82,4 % “as guaranteed” by the maker of the fired heater.

The two other Sankey diagrams show the energy balance of the heaters A and B before the implementation of the measures. They run with an efficiency of 60,6 % and 62,35 %, a “real world situation of one fired heater” /

The arrows branching off at the top show the heat losses. I like the fancy icons that show how energy is lost through the walls, because of deteriorated or insufficient insulation, and heat energy in the effluent gases. The flows are given in MMBTU/h (millions of BTU per hour).

Unfortunately two of the diagrams are not to scale: The arrow to the right in the second diagram should be roughly 2/3 of the width on the left side. It is about 4/5 (or 80 %) of the width, similar to the width in the first Sankey diagram. This is a visual exaggeration of the inefficiency. However, I refrained from featuring this in my informal “Lying with Sankey diagrams” series. 😉

Edit 05/2015: the web pages are not acessible any more. I had to restore the image from a local copy, and removed references to two other diagrams I had references to. -Phineas