Tag: Brazil

Cogen System Thermodynamic Analysis

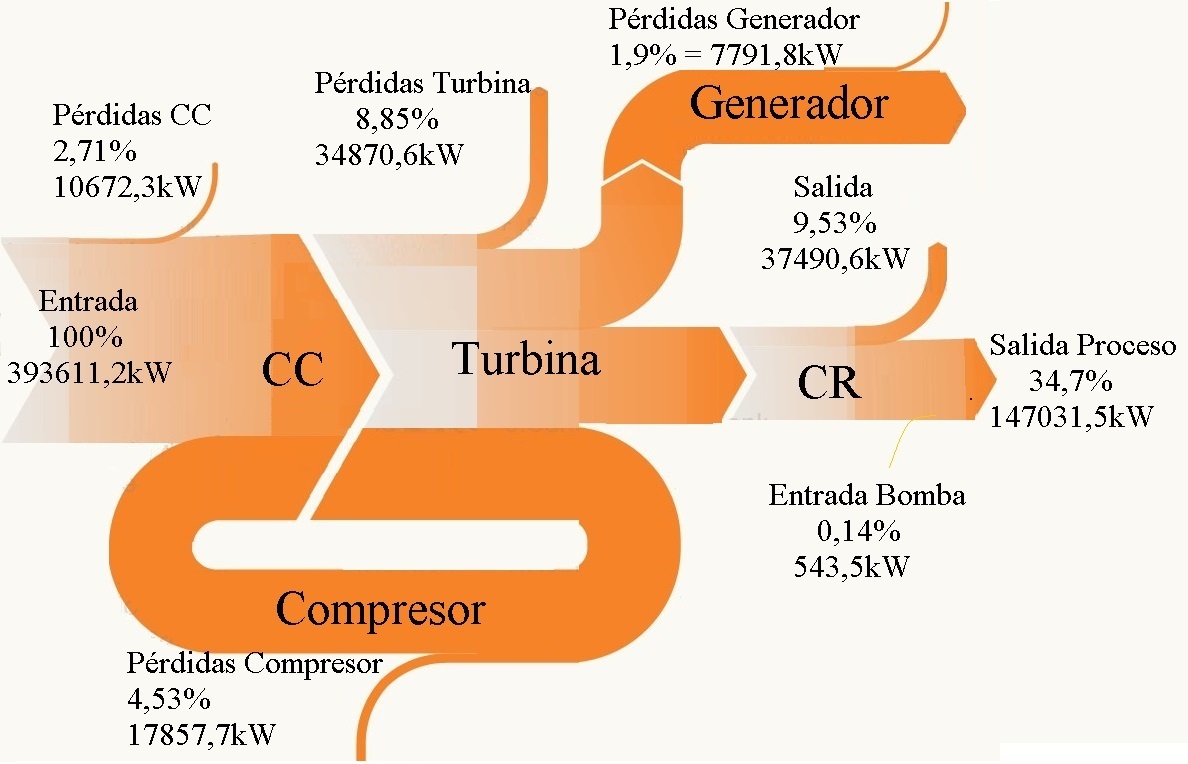
An analysis of energy efficiency and exergy effciency of a cogeneration system in a sugar refinery in São Paulo state in Brazil is presented in the ‘Análisis energético, exergético y económico de un sistema de cogeneración: caso para una planta azucarera de San Pablo’ by Omar R. Llerena of Universidade de São Paulo (Published in: Ingenius no.19 Jan/Feb 2018 under Creative Commons license CC BY-NC-SA 4.0)


Flows are in kW, and even though this diagram appears to be ‘casero’ made from blocks, triangles and curve shapes, the flow widths seem pretty much to scale.
Acronym ‘CC’ is for the combustion chamber and ‘CR’ stands for a heat recovery boiler (caldera de recuperación).

The article also features a Grassman diagram for the exergy analysis. So, if you are interested, please visit the article here.

Greenhouse Gas Emissions Brazil 2012

SEEG Sistema de Estimativas de Emissões de Gases de Efeito Estufa (Greenhouse Gas Emissions and Removals Estimates System) is an initiative of the Observatório do Clima (Climate Observatory) in Brazil.

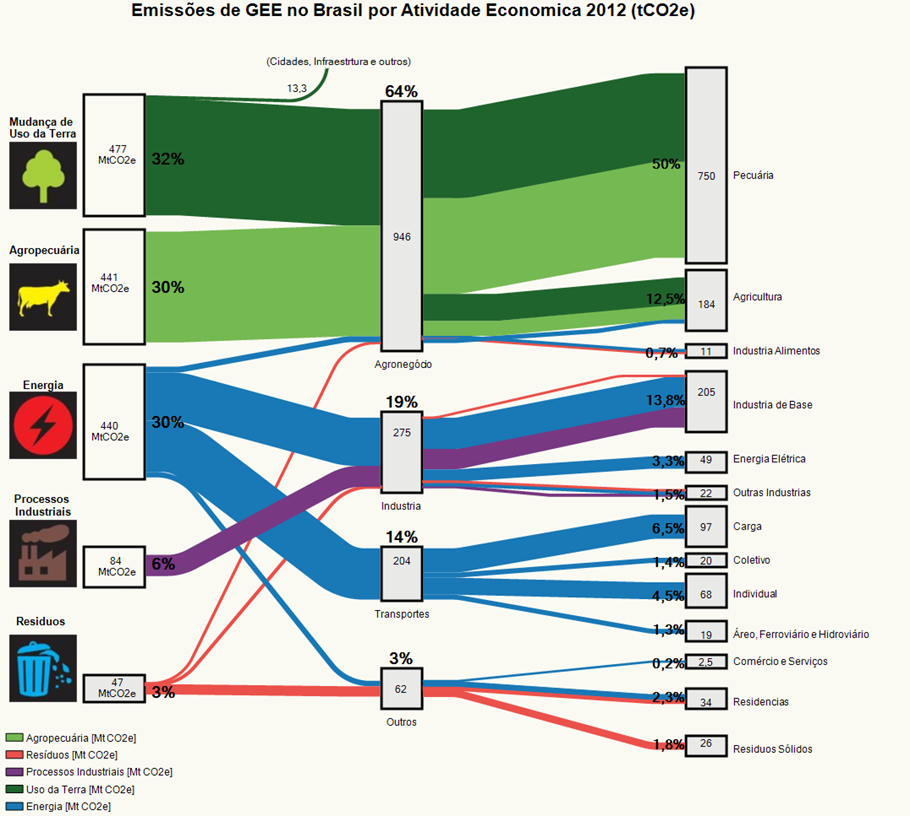
This Sankey diagram on the SEEG web page (in Portuguese) shows greenhouse gas (GHG) emissions in Brazil in 2012.

On the left are the emitters by sector: land transformation, livestock farming, energy generation, industrial processes and waste sector. Emissions are grouped in the middle column by activity: agriculture, industry, transport and other. The third column is a detailed breakdown of the activity sectors.

The agricultural sector contributed 64% of Brazil’s GHG emissions in 2012, with most likely methane (CH4) from livestock breeding and CO2 release from deforestation as the major sources.

Emissions are shown in Mt CO2-e[quivalents], even though the caption says differently. Overall greenhouse gas emissions were 1490 Mt CO2e (or 1.49 bn tonnes CO2e). Detailed data is available on the website, so this can be seen as the consolidated overview of GHG emissions.

More recent GHG data for 2017 from Brazil has been published at an event in November 2018 in São Paulo, but I couldn’t find a Sankey diagram (yet).

LatAm BEN – Brazil

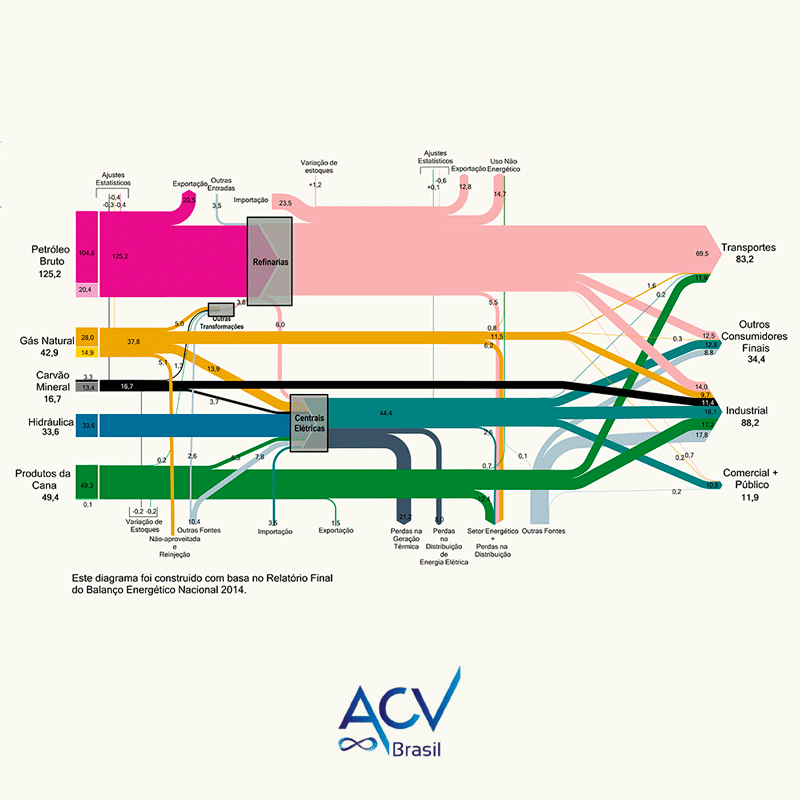
Working my way up the southern cone, here is the Balanço Energético Nacional 2014 for Brazil. Found this on the webpage of Curitiba based consulting firm ACV Brasil.

The national energy balances for Brazil are published annually by the Ministério de Minas e Energia (MME), and newer reports are available (PDF for 2018, large!). However, the energy flows diagrams in these official reports are less refined, so I opted to go with the remake by ACV.


The unit of flow is not shown, but my guess is that it is Mtep. like in the original publication.

A day in the life of… Victor Hugo

I admire architects for their visionary ideas, for being able to transcend established limits, for pushing things beyond the common … at least when still in early phases of a project.

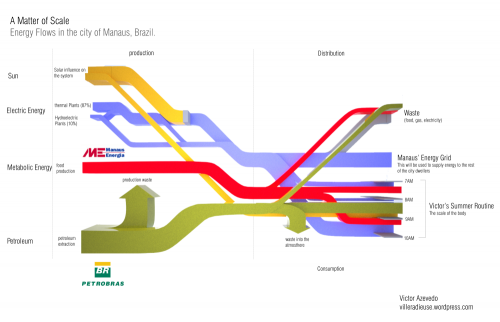
Victor Hugo Azevedo’s blog is called ‘La Ville Radieuse’ (The Radiant City) after a concept by Le Corbusier. It has all kinds of architectural stuff. By mere coincidence I discovered the following Sankey diagram he did in 2011 as class assignment on energy flows…

“This time we were asked to trace the energy flow that directly affect us. I traced the beginning of a common day during my summer in the city of Manaus Brazil. The following diagram shows how the larger infrastructure shape my routine.”

This looks at first sight like one of the classic ‘national energy flow’ Sankey diagrams with fuels (production) on the left, distribution and consumption on the right. But this is only partly true. Look at the right part where the energy flows stack and have a vertical time line.

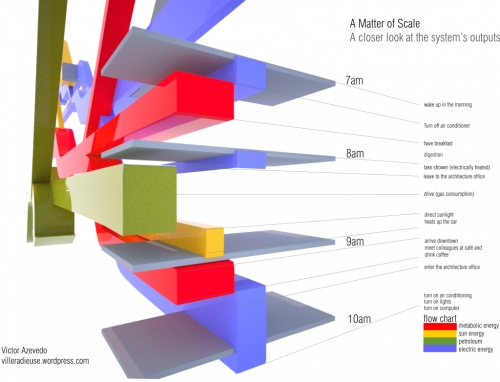
“The next diagram is nothing more than a closer look into one of the ends of the diagram, which is my own routine on a four hour span (from 7AM to 10AM on a regular weekday in June)”

So forget about scale and units here … this is a concept diagram! The Sankey diagram links an individual’s consumption patterns with the bigger picture, thus stressing everybody’s personal share and responsibility in energy consumption (and the possibility to take action). Kudos for this idea!

Apart from that it is of course a fancy 3D rendering, and I love the rotation and close-up of the morning routine. Make sure you post a comment directly at Victor’s post, if you like it as much as I do!

Note: Somewhat related, check out Molly Eagan’s ‘Where is Petroleum in our Daily Lives’ here.