Just returned from a short break … trying to get back into the regular blogging mode again. Here is a quick one from my bookmarks.
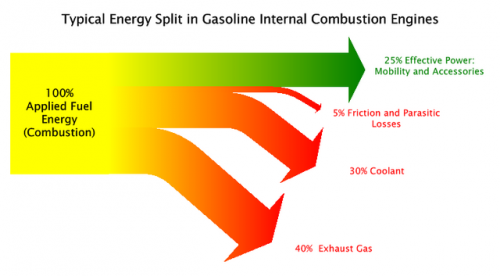
The Sankey diagram below illustrates a research project at Hannover University on energy management of automobiles. Similar to the Sankey diagram shown in this post it shows how total energy from gasoline is used in different components of a car.
The Sankey diagram is symbolic I assume, still one can see that large portions of the energy are lost in the exhaust gas (“Abgas”) and for motor cooling (“Kühler”). Flow quantities are given in Watt, not sure if that is per hour at a given speed or in idle mode.

