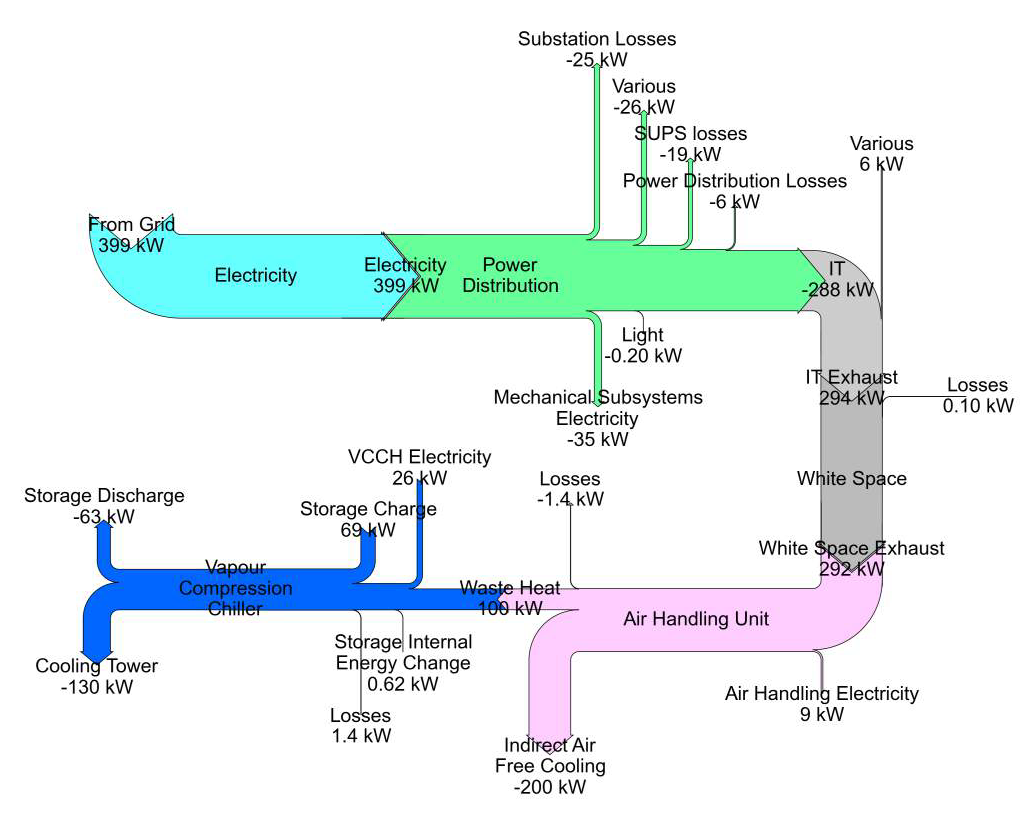
The European R&D project RenewIT studied energy concepts for renewable energy supply of data centres. The project partners from Spain, Italy, UK, Germany and The Netherlands looked at 18 different energy models.
In the final project report each of the concepts are described, accompanied by a Sankey diagram.
The above is figure 3.53 from p. 177 of the report showing the “Sankey chart for the distribution of average energy flows per year within different subsystems of concept 7 for scenario 3”.
Many more equally beautifully crafted Sankey diagrams can be found in the report, check chapter 3.5 Simulation Results of the publication Deliverable D4.5 Catalogue of advanced technical concepts for Net Zero Energy Data Centres. Authors: Nirendra Lal Shrestha, Noah Pflugradt, Thorsten Urbaneck (TUC); Angel Carrera (Aiguasol); Eduard Oró, Albert Garcia (IREC); Hans Trapman, Gilbert de Nijis, Joris van Dorp (DEERNS); Mario Macías (BSC) (get it here)
