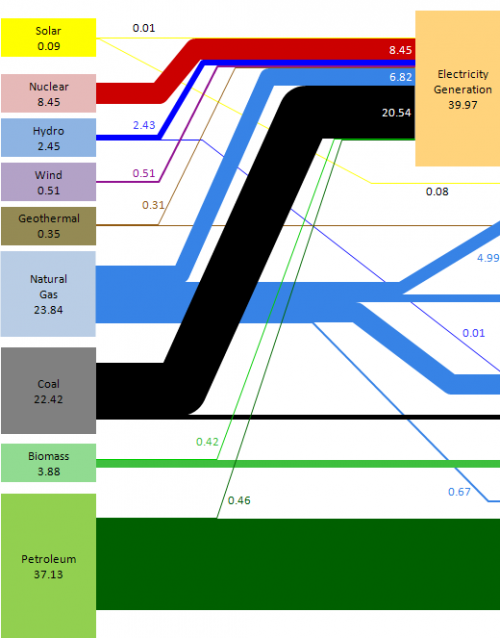
Does it take a hero like Daniel Ferry from the Excelhero blog to do a Sankey diagram in Excel? Well, you may not have to be a hero, but as Daniel puts it, this is “… seriously tedious work, as Excel has no native chart type to do what is required automatically.”
Daniel used the LLNL 2008 U.S. energy flow charts as model for his Sankey diagrams in Excel. Here is what he came up with (clipped section):
Actually the result is quite close to the original Sankey diagrams, with similar colours, arrow routing, and even the same fonts.
Daniel explains:
“I lightened the colors on the input boxes (had to do it), but otherwise I think my rendition is faithful to the original. I may have stayed too true to flow pipe proportionality. Some of them are so thin they do not print well. This should be addressed. While my pipes are seemingly lined up, they will not survive the chart being resized vertically without some small errors, either gaps in a pipe stack, or overlap.
(…)
An interesting project would be to create an Excel addin that would allow you to specify category box locations and have VBA do all of the grunt work in lining up the flow pipes, automatically creating the chart. (…) In it’s current form no VBA was used. “
So, if you wish to draw a Sankey diagram with the Microsoft Office package installed on your computer, and enjoy using VBA, you might want to give it a shot. Gabor Doka’s Sankey helper (an Excel macro) is another option. Dedicated Sankey diagram software tools are available. It would recommend one of those, if you need to produce more than one Sankey diagram, or wish to make updates to your diagram and layout adaptations more comfortably.
BTW, here is the story on the man behind the Sankey diagrams at LLNL.
