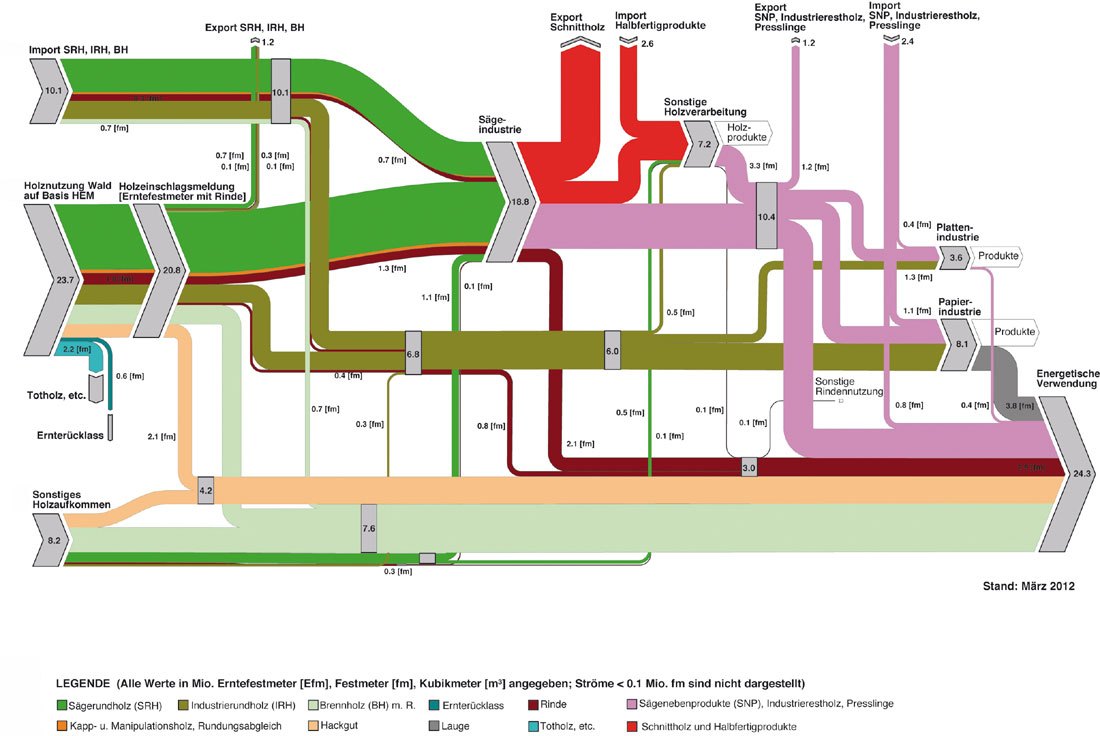
A beautifully crafted Sankey diagram on wood in Austria can be found in the 2012 article ‘Die Bedeutung von Holz als erneuerbarer Energieträger’ (translation: ‘The importance of wood as a renewable energy source’) by Kasimir Nemestóthy on the waldwissen.net website. These are the wood streams in Austria in 2010.
All streams in solid cubic metre of wood (“Festmeter”, fm). Smaller streams less than 0.1 mio solid cubic metres are not displayed.
Here is how the diagram is structured: on the left the sources of wood with imports, harvesting from forests and other non-forest wood sources. Imports and harvested wood is directed mainly to sawmills (“Sägeindustrie”) and to paper industry. Non-forest wood as well as losses from wood industry (bark, wood chips) are for energetic use.
The dark green arrow is saw round wood with the bordeaux-colored stream representing bark. The brown arrow is industrial round wood of lesser quality, mainly used in paper industry. The light pink and light green arrows represent wood chips and firewood. Along with remains from the saw mills and paper industry it is destined for energetic use.
One minor design flaw at the top (arrow from imports to saw mills) where the green arrow overlaps the orange and red arrow in the curve), but by the untrained Sankey eye this will probably rarely be noticed.
There is a second Sankey diagram in the article that details the energy use, but I will save that one for a separate post.


