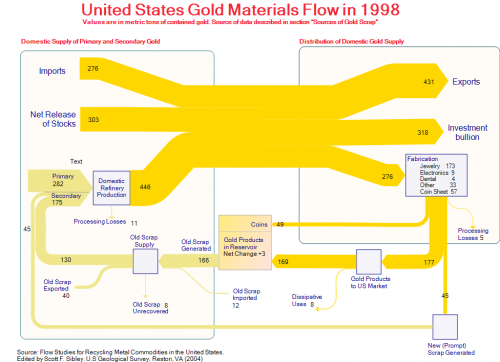
This Sankey diagram was posted as a sample on the e!Sankey Forum. It shows the gold flows in the United States in 1998. The original data is from ‘Flow Studies for Recycling Metal Commodities in the United States’ (edited by Scott F. Sibley. U.S Geological Survey, Reston, VA (2004)). Values are in metric tons of contained gold.
The left part of the diagram shows domestic supply of primary and secondary gold, as well as imports to the U.S., the right part distribution and use of gold. The U.S. is a net gold exporter. 318 metric tons gold bullion went to Fort Knox (presumably) that year. 276 metric tons were fabricated into products, mainly jewelry. At the same time 175 metric tons of new and old gold scrap were recycled. Along with the 282 metric tons out of primary production they are fed back into the production cycle.
The diagram has gold/light brown colored Sankey arrows that go along well with the topic. A text label has been forgotten in the left part.

