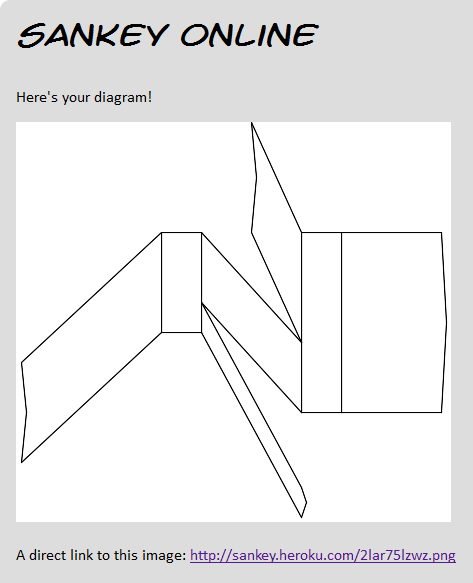
Steve Bogart has released a website for autoMATICally creating simple horizontal distribution diagrams. No need to install a tool, just go to sankeymatic.com and enter your values. On each line define source node, quantity in square brackets, destination node (e.g. “Budget [450] Housing” or “Budget [300] Food”). Columns and bands will be created automatically.
A number of options can be set, such as colors, spacing and labels. Finally, when you have created your diagram you can download it directly (three sizes/resolutions available).
This simple online tool is based on the open source tool D3.js and its Sankey library.
I have added SankeyMATIC to the list of software tools for Sankey diagrams (seriously thinking about creating an own group for d3.js-based products).

