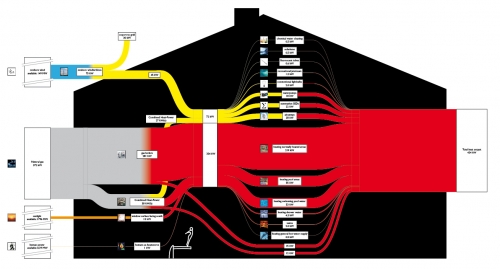
Found five beautifully made Sankey diagrams on the Dutch website Energy Transparency. They all show the energy balance of indoor swimming pools. One of these diagrams is shown below.
Electricity is shown as yellow streams, heat in red. Natural gas is the main source of heat, but they also seem to have wind power. Even solar radiation entering through the south-faced windows and human heat is accounted for. In the middle tier we can see the consumers of heat and electricity.
Another one of the Sankey diagrams on this page differentiates the losses of heat (through chimney, doors, windows, …) too. Definitely one of the best Sankey diagrams I have seen recently.
